Welcome to Edinburgh Instruments monthly blog celebrating our work in Raman, Photoluminescence, and Fluorescence Lifetime Imaging. Every month we will highlight our pick for Map of the Month to show how our spectrometers can be used to reveal all the hidden secrets in your samples.
2D materials are an emerging class of thin-layer crystals of interest due to their unique optoelectronic properties. The first in this class to gain traction was graphene, now inorganic 2D materials called transition metal dichalcogenides (TMDs) are gaining popularity. The most commonly studied materials in this field are MoS2, MoSe2, WS2, and WSe2. In bulk form these materials have an indirect band gap, however, when they are grown as monolayer and few-layer crystals, they become direct band gap semiconductors. This property in particular has prompted substantial research into their physical characteristics for optoelectronic devices.
Identifying the number of layers, strain, defects, and doping in 2D TMDs is critical for using these materials successfully. Raman and photoluminescence (PL) microscopy can provide highly detailed sample information in these crucial areas. A 532 nm excitation will provide both Raman and PL spectra from 2D TMDs and their bands can be analysed for complex sample evaluation.

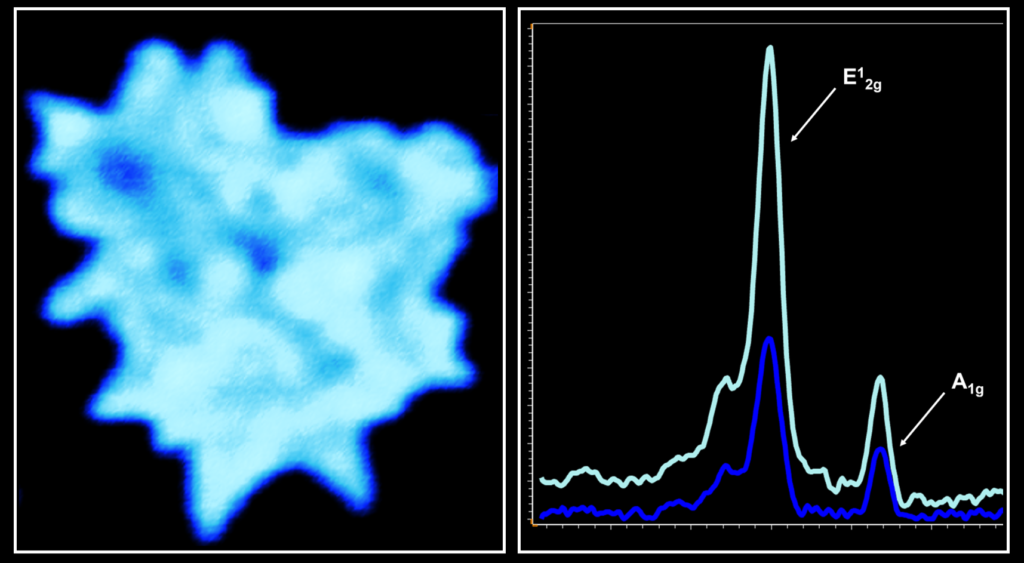
Figure 1: Raman intensity map (left) and representative spectra (right) from a WS2 crystal at areas of different layer thickness.
WS2 is an interesting 2D TMD not only for the properties it shares with other materials in this category, it also offers additional advantages such as strong thermal stability and ambipolar field-modulation behaviour. The main two bands of interest in the Raman spectrum are the E12g and A1g modes representative of in-plane and out-of-plane vibrations respectively. As the number of layers increases so too does the Raman intensity of these bands, therefore, imaging a WS2 crystal reveals areas of higher intensity that in turn represent increased layer thickness, Figure 1.

Figure 2: PL intensity map from a WS2 crystal.
PL mapping is particularly sensitive to the number of layers as well. In fact, the PL peak only appears as we obtain thin layers of WS2, and bulk material produces no PL. These crystals are particularly large and areas of the crystal produce little to no PL indicating a thick layer of WS2 where it is starting to lose its direct band gap, Figure 2. When looking at a sample which presents areas of monolayer and multilayer WS2, the PL intensity can easily be used for layer evaluation. Figure 3 details such a case, the reflected brightfield image (Figure 3(a)) shows a triangle which appears to have multiple layers of WS2 in the centre. Plotting the PL intensity map reveals no PL response in the centre meaning there is a thicker layer of WS2 present in the centre, Figure 3(b).

Figure 3: Analysis of a WS2 crystal – (a) brightfield reflected image (b) PL intensity map (c-d) PL spectra from an area of monolayer and multilayer WS2, highlighting intensity and peak position respectively.
Figure 3(b) also shows a variation in PL intensity on the outer triangle of the sample, this is representative of monolayer and multilayer WS2. The difference in intensity between areas of monolayer and areas of multilayer WS2 has been plotted in Figure 3(c) to highlight the significant difference in intensity between the two areas. A shift in PL peak position is also seen, Figure 3(d), as the sample becomes monolayer the peak is red-shifted in comparison to areas of multilayer WS2 (note the spectra have been normalised for simple comparison).
To find out more about how our Raman Microscopes can benefit your research, contact our sales team today who will be happy to help you.
If you have enjoyed reading this application note, why not sign-up to our monthly eNewsletter via the button below or follow us on your favourite social media channel in the footer below to keep up to date with our latest news and research.