Skip to content
Skip to content
  • News
  • Events
  • eBooks
  • Blog
  • Careers
  • Contact
  • News
  • Events
  • eBooks
  • Blog
  • Careers
  • Contact
KNOWLEDGEBASE
  • About Us
  • Products

    Fluorescence Spectrometers

    • FLS1000 Photoluminescence Spectrometer
    • FS5 Spectrofluorometer
    • LifeSpec II Lifetime Spectrometer
    • Mini-tau Lifetime Spectrometer

    Raman Microscopes

    • RM5 Raman Microscope
    • RMS1000 Multimodal Confocal Microscope

    Transient Absorption

    • LP980 Transient Absorption Spectrometer

    FTIR Spectrometers

    • IR5 FTIR Spectrometer

    Lasers and LEDs

    • Pulsed Lasers
    • Gas Lasers
    • Customisation Options
    View All Products
  • Techniques
  • Applications
KNOWLEDGEBASE
Edit Content
  • About Us
  • Products
  • Techniques
  • Applications
  • Knowledgebase
  • eBooks
  • News
  • Events
  • Blog
  • Careers
  • Contact Us
  1. Home
  2. Blog Post
  3. Shining a Light on Bone Composition Using Raman Spectroscopy

BLOG

Shining a Light on Bone Composition Using Raman Spectroscopy

  • October 26, 2022
Edit Content

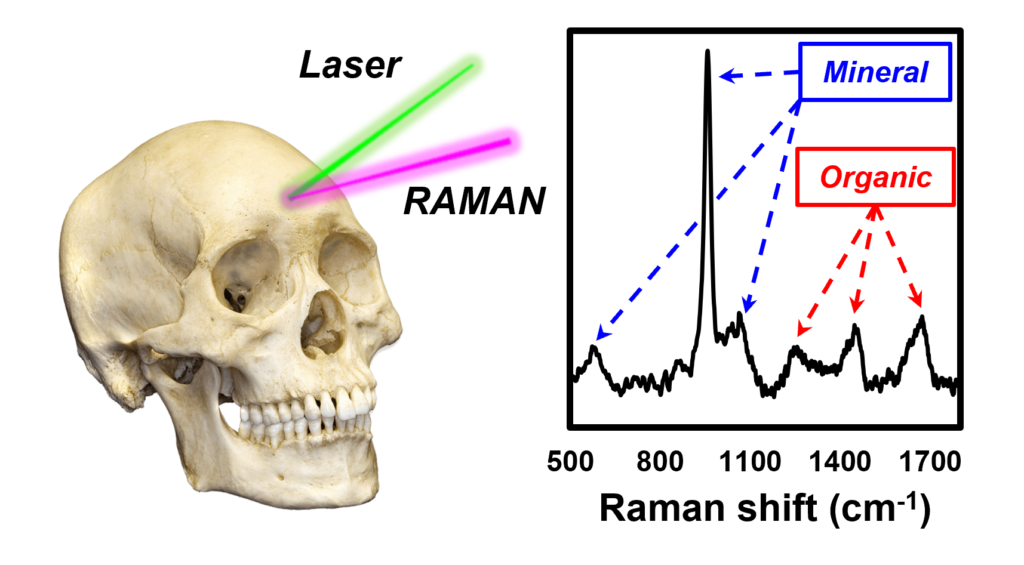
As well as rising from the grave to wander the earth and haunt us every Halloween, skeletons are made of hard, metabolically active bone tissues that perform several major functions to help our bodies thrive. These includes maintaining and supporting our shape, allowing us to have a dynamic range of movement, protecting our vital organs from damage, producing blood cells, and storing key nutrients.

Bone tissue consists of cells embedded within an extracellular matrix made up primarily of collagen and crystals of calcium hydroxyapatite. It is these organic and mineral constituents of the matrix that gives bone its strength. Despite being exceedingly sophisticated and refined, it turns out that there may be reason to sympathise with our spooky and supernatural skeletal chums. Bone tissue is susceptible to a wide range of diseases that have the potential to drastically diminish quality of (after)life, including osteoporosis and osteoarthritis. These disorders cause changes in the mechanical properties of bone that in turn can be understood by exploring its composition and structure.

Raman spectroscopy is a terrific technique for studying biological tissues such as bone because it can be applied to fixed and fresh specimens with minimal sample preparation, it allows for non-destructive chemical analysis, and it provides us with a wealth of information in a single spectrum.1–3 In this blog post, we look at different types of bone samples using the Edinburgh Instruments RM5 Raman Microscope, Figure 1.

The RM5 Raman Microscope was used to analyse bone composition

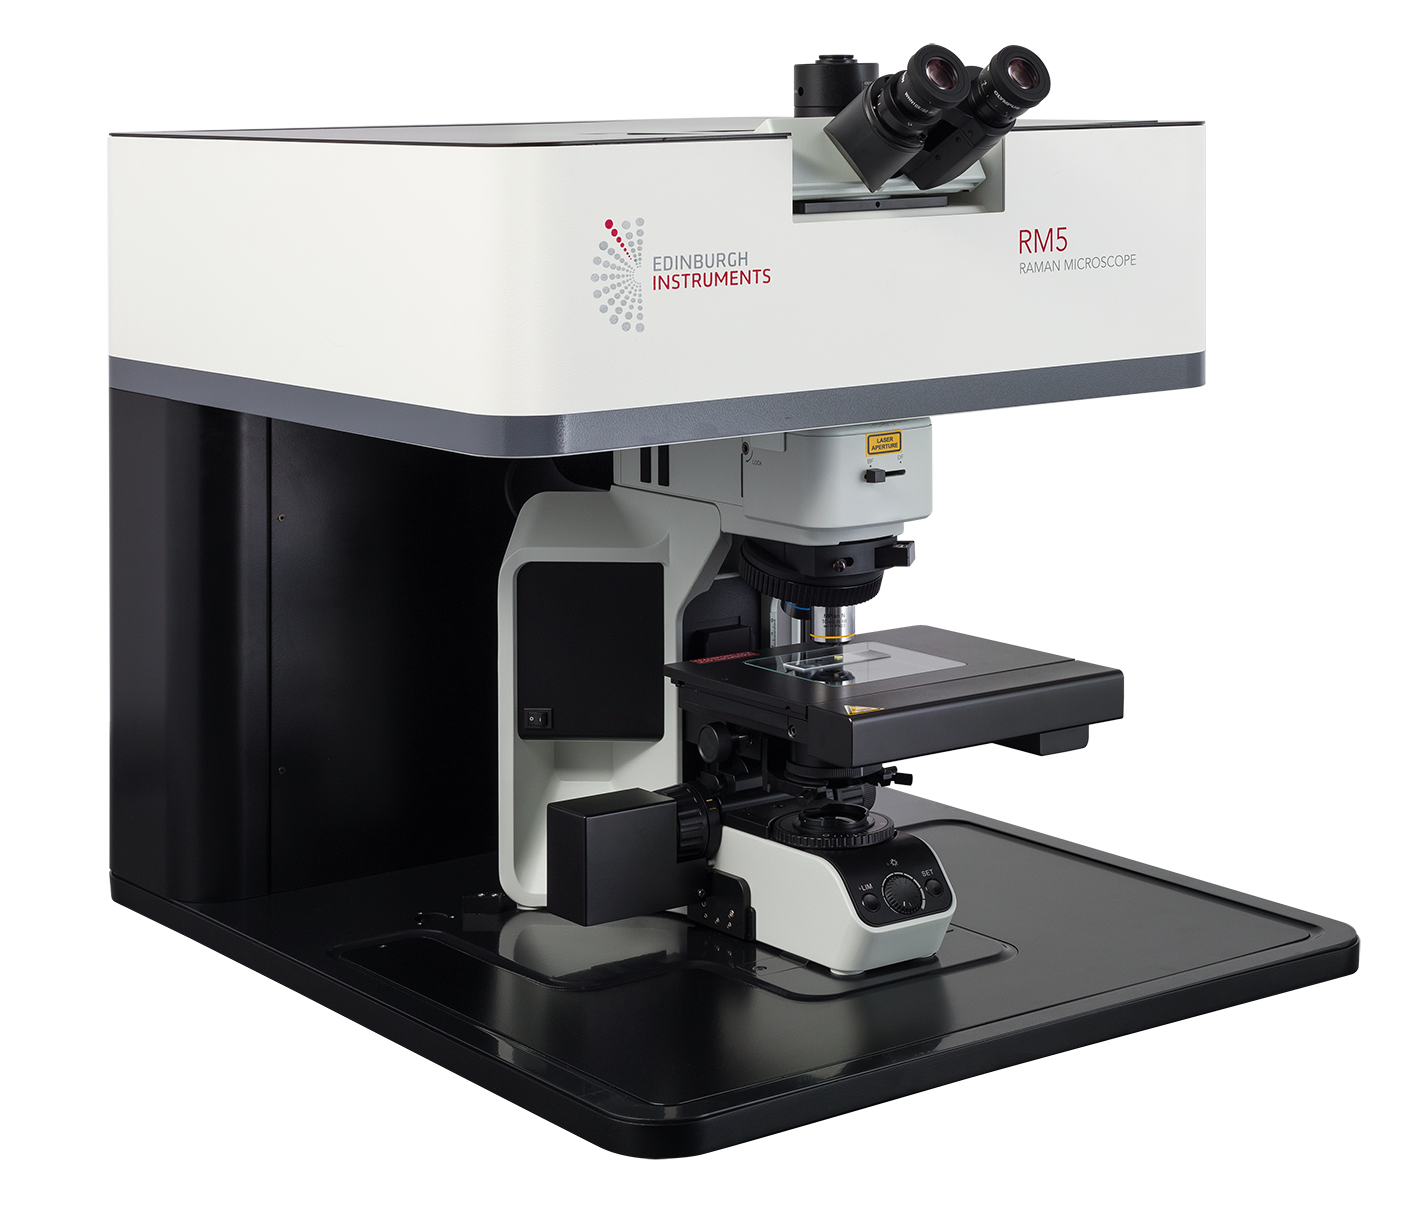
Figure 1. RM5 Raman Microscope.

The first sample analysed consisted of a segment of compact bone tissue fixed on a glass slide. Compact bone is extremely strong and dense in order to withstand bending and compression. It is found in the shaft of long bones such as the femur and the tibia. The slides were prepared specifically to show transverse and longitudinal sections of compact bone, Figure 2A and 2B. The spectrum from the transverse section of bone, excited with a 532 nm laser, is shown in Figure 2C. Like all biological samples, the tissue contains several diagnostic bands within the fingerprint region, which is typically between 400 cm-1 and 1800 cm-1, indicative of carbohydrates, DNA, lipids, and proteins. Additionally, bands associated with carbonate and phosphate anions from bone mineral are observed in the fingerprint region. However, their intensity is low because the sample was prepared specifically to show cells and therefore has a lower degree of mineralisation than untreated bone.

The high-wavenumber region of the Raman spectrum, Figure 2D and 2E, between 2700 cm-1 and 3500 cm-1 has bands indicative of C-H, N-H, and O-H stretching modes of biological species such as DNA, lipids, and proteins.4

Raman spectrum used to analyse bone composition

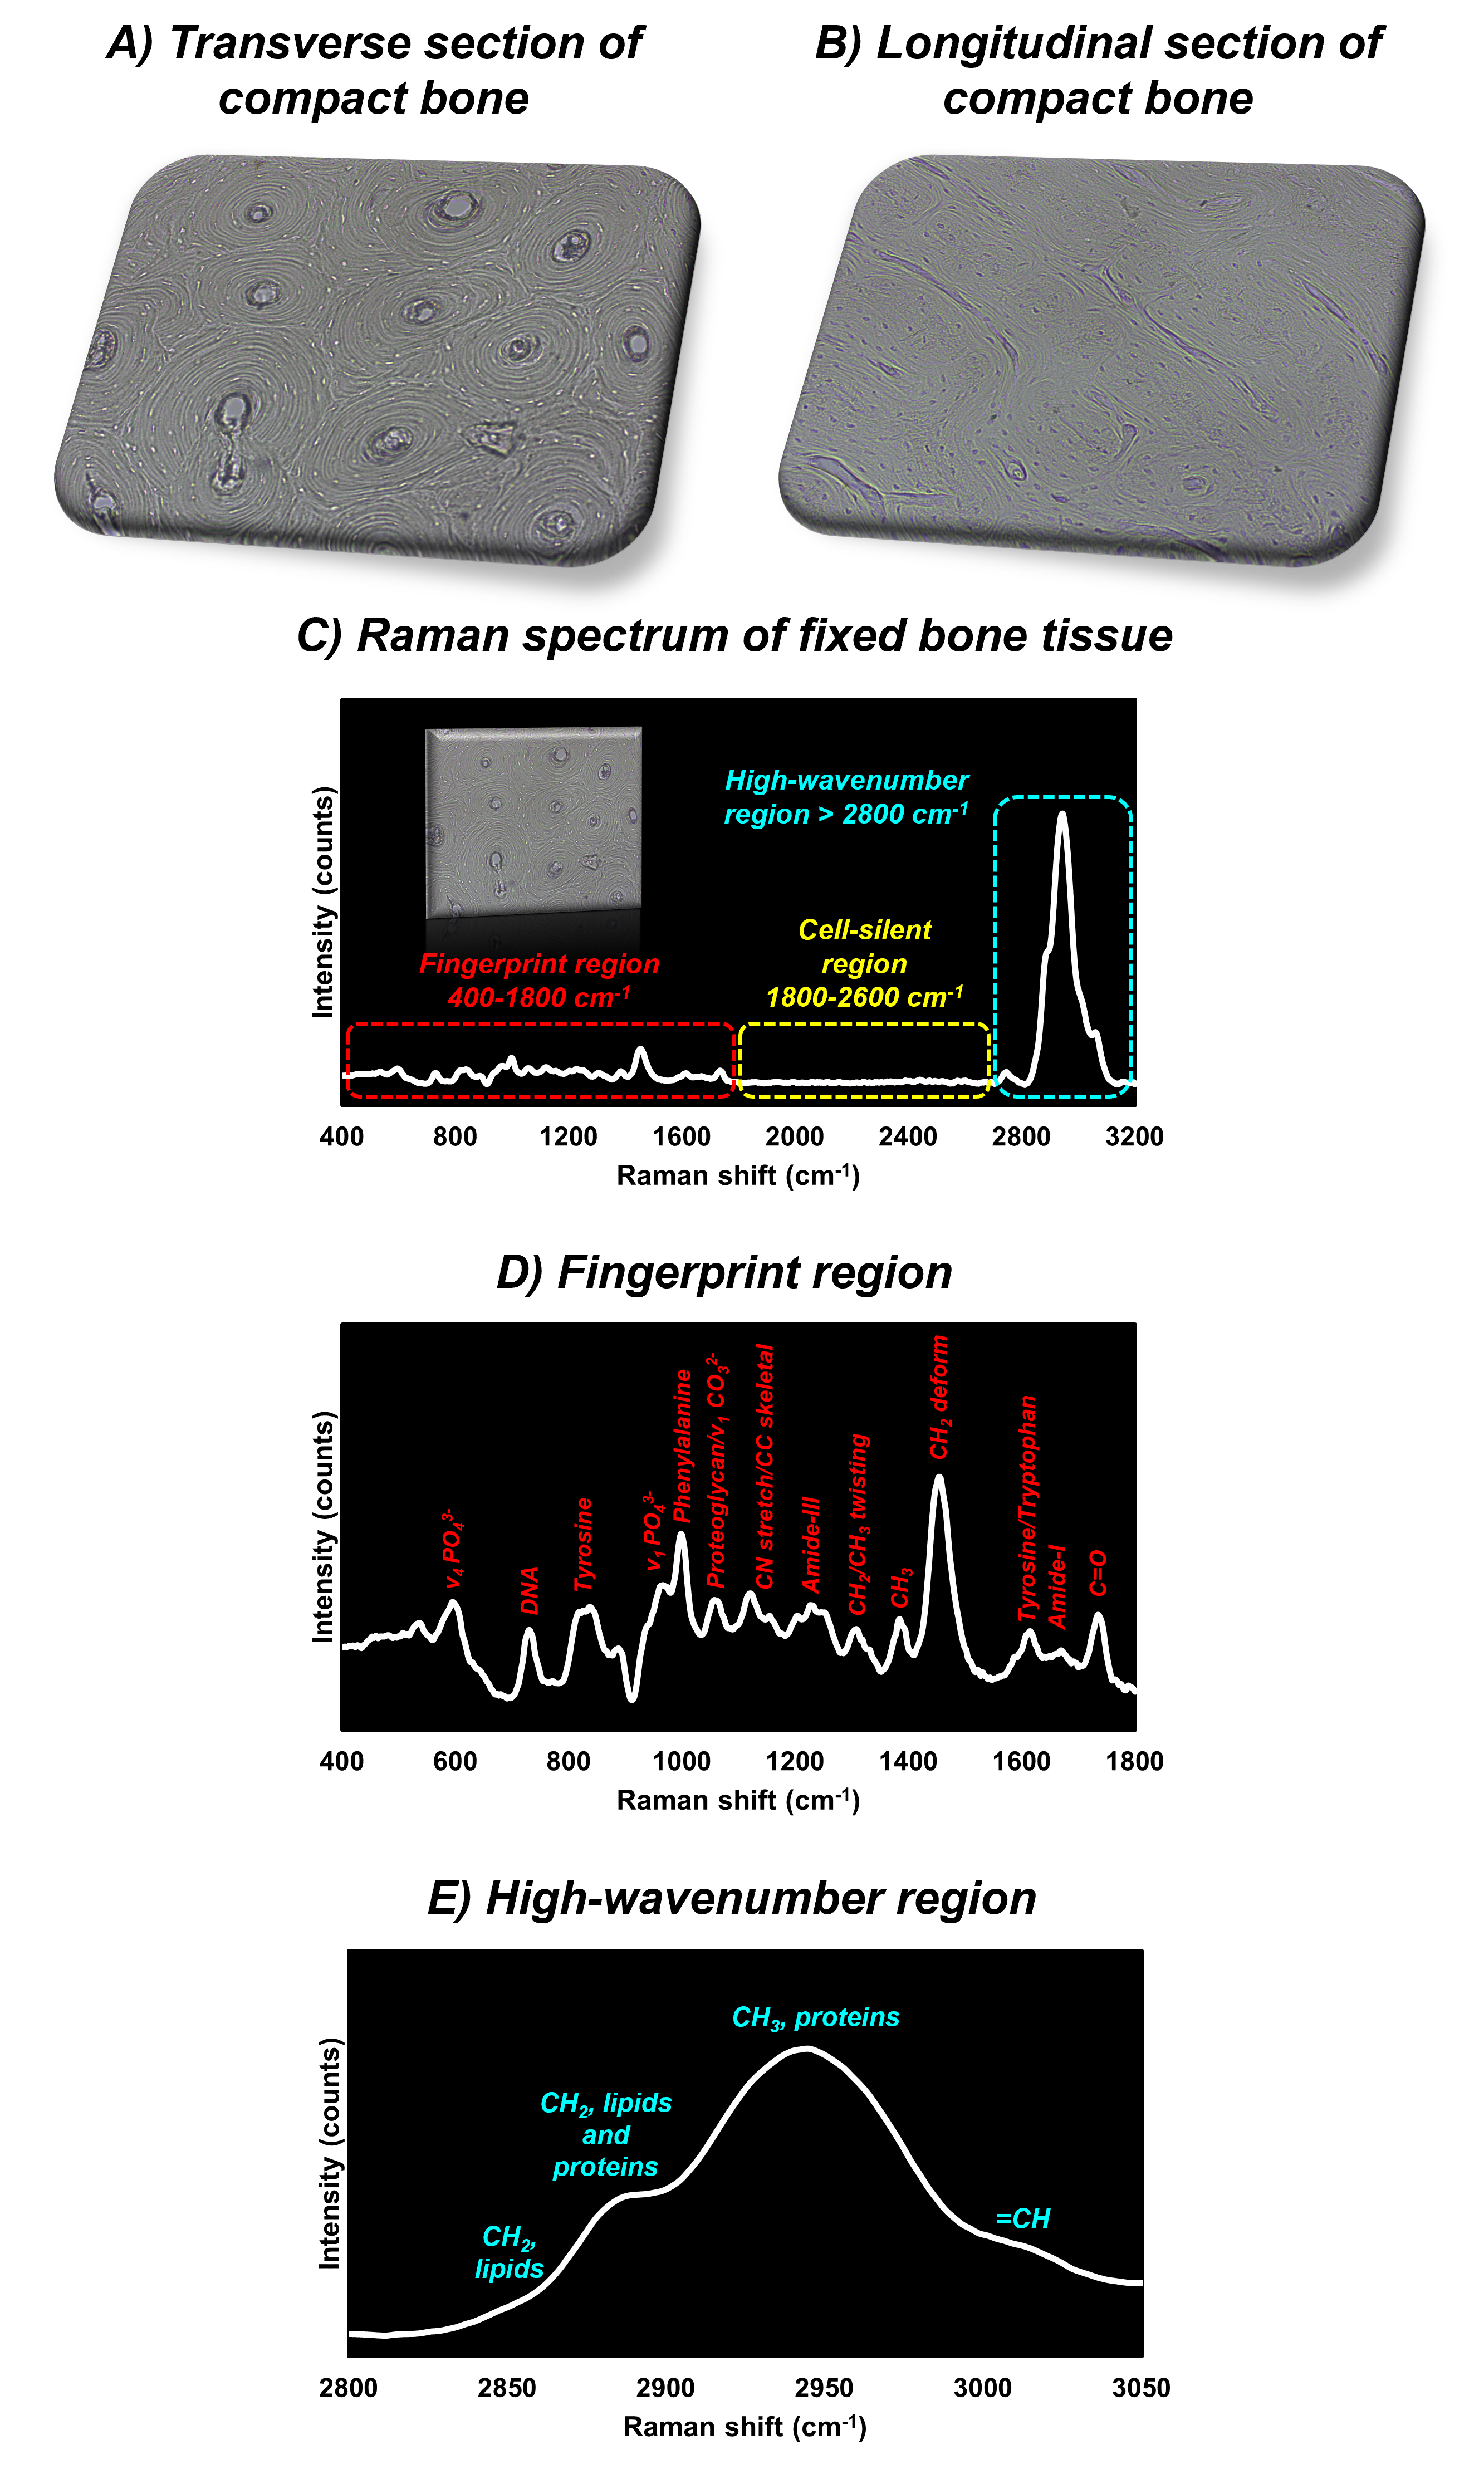
Figure 2. Raman spectroscopic analysis of fixed compact bone tissue.

The second kind of sample analysed, selected because it offers a great comparison to fully mineralised bone, was an untreated tooth. In this experiment, the Raman spectrum of the root of the tooth was collected under 532 nm excitation, which can be observed in Figure 3. The Raman spectrum of the untreated and mineralised tissue can be broadly categorised as before into fingerprint, cell-silent, and high-wavenumber regions. In Figure 3B we can now see that the bands suggestive of mineral components, such as carbonate and phosphates, are much more intense than the bands from the fixed compact bone tissue analysed before. This is best demonstrated by the most intense band at 960 cm-1, which can be assigned to the phosphate group found in the mineral component of the tooth and bone.

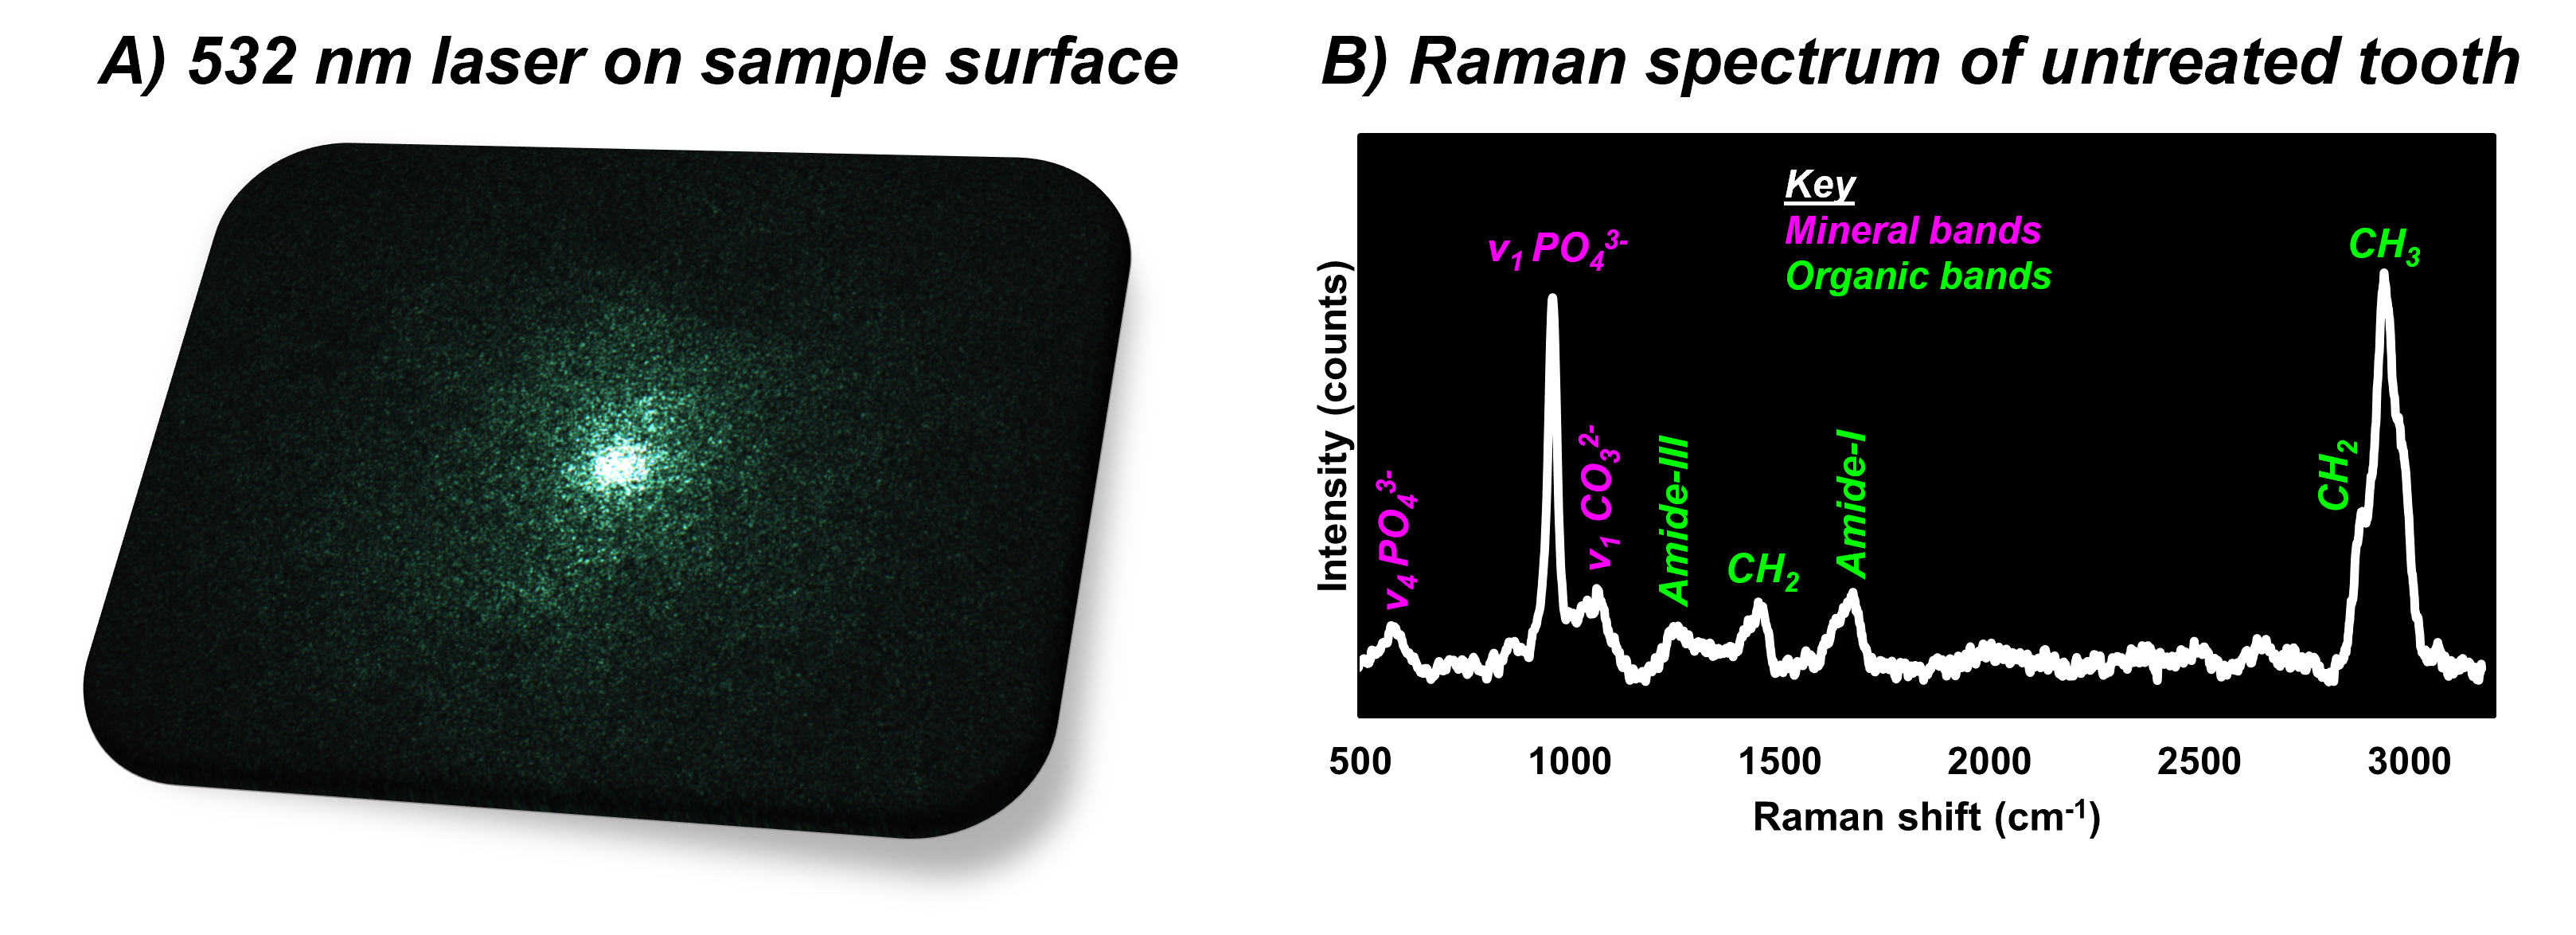
Figure 3. Raman spectroscopic analysis of an untreated tooth sample.

For more information on Raman spectroscopy, please visit our learning centre or check out our application notes.


Keep in Touch

If you have enjoyed this article, be sure to sign up to our eNewsletter or follow us on social media using the links below.

References

  • Unal et al., Compositional Assessment of Bone by Raman Spectroscopy, Analyst, 2021, 146, 7444-7470, DOI: 10.1039/D1AN01560E.
  • G. Kerns et al., Evidence from Raman Spectroscopy of a Putative Link Between Inherent Bone Matrix Chemistry and Degenerative Joint Disease, Arthritis Rheumatol., 2014, 66, 1237-1246, DOI: 10.1002/art.38360.
  • Buchwald et al., Identifying Compositional and Structural Changes in Spongy and Subchondral Bone from the Hip Joints of Patients with Osteoarthritis Using Raman Spectroscopy, J. Biomed. Opt., 2012, 17, 017007, DOI: 10.1117/1.JBO.27.9.095003.
  • Gaba et al., Raman Spectroscopy in Prostate Cancer: Techniques, Applications and Advancements, Cancers, 2022, 14, 1535, DOI: 10.3390/cancers14061535.

RELATED PRODUCTS

RMS1000

Multimodal Confocal Microscope

VIEW

RM5

Raman Microscope

VIEW

RESOURCES

Tags:
  • Forensics
  • Life Science
  • RM5
  • RMS1000
  • Raman
Related Posts:

No results found.

Suggested Reading:

What is Raman Spectroscopy?

View more »
Share:
PrevPrevious
NextNext

Keep up to date with the latest from Edinburgh Instruments

Join our mailing list and keep up with our latest videos, app notes and more!

LOCATION:
  • Edinburgh Instruments Ltd.
    2 Bain Square, Kirkton Campus, Livingston, EH54 7DQ.
  • sales@edinst.com
  • +44 1506 425 300
ABOUT:
  • About Us
  • Techniques
  • Applications
  • Knowledgebase
  • About Us
  • Techniques
  • Applications
  • Knowledgebase
PRODUCTS:
  • Fluorescence Spectrometers
  • Raman Microscopes
  • UV-Vis Spectrophotometers
  • Transient Absorption
  • FTIR Spectrometers
  • Lasers and LEDs
  • Customisation Options
  • Software
  • Upgrades
  • All Products
  • Fluorescence Spectrometers
  • Raman Microscopes
  • UV-Vis Spectrophotometers
  • Transient Absorption
  • FTIR Spectrometers
  • Lasers and LEDs
  • Customisation Options
  • Software
  • Upgrades
  • All Products
LEGALS:
  • News
  • Events
  • Blog
  • Careers
  • Contact Us
  • Terms and Conditions
  • Privacy Policy
  • News
  • Events
  • Blog
  • Careers
  • Contact Us
  • Terms and Conditions
  • Privacy Policy
SOCIALS:
Youtube Linkedin X-twitter Facebook
©2024 Edinburgh Instruments. Registered in England and Wales No: 962331. VAT No: GB 271 7379 37
Manage Consent
To provide the best experiences, we use technologies like cookies to store and/or access device information. Consenting to these technologies will allow us to process data such as browsing behaviour or unique IDs on this site. Not consenting or withdrawing consent, may adversely affect certain features and functions.
Functional Always active
The technical storage or access is strictly necessary for the legitimate purpose of enabling the use of a specific service explicitly requested by the subscriber or user, or for the sole purpose of carrying out the transmission of a communication over an electronic communications network.
Preferences
The technical storage or access is necessary for the legitimate purpose of storing preferences that are not requested by the subscriber or user.
Statistics
The technical storage or access that is used exclusively for statistical purposes. The technical storage or access that is used exclusively for anonymous statistical purposes. Without a subpoena, voluntary compliance on the part of your Internet Service Provider, or additional records from a third party, information stored or retrieved for this purpose alone cannot usually be used to identify you.
Marketing
The technical storage or access is required to create user profiles to send advertising, or to track the user on a website or across several websites for similar marketing purposes.
Manage options Manage services Manage {vendor_count} vendors Read more about these purposes
View preferences
{title} {title} {title}