We have created a useful guide for those working in the field of Raman Spectroscopy which details a range of measurement examples. These examples, including polarised Raman spectroscopy, were all achievable using Edinburgh Instruments’ RM5, a compact and fully automated Raman microscope.
Optional accessories in the RM5 allow the user to control the polarisation of the excitation light and analyse different Raman scattering polarisations. Examining spectral information obtained by polarised Raman spectroscopy can provide insights into the symmetry of vibrational modes, as well as the orientation of samples such as single crystals, polycrystalline samples, and anisotropic materials.
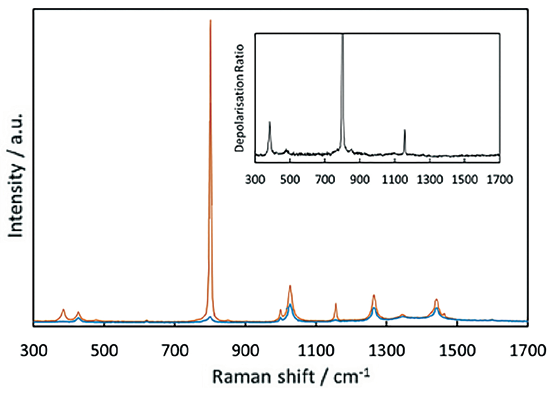
For example, cyclohexane contains several peaks which arise from exclusively symmetrical vibrations, as indicated in the depolarisation ratio function.

Figure 1: Cyclohexane, excited with 785 nm laser. Parallel polarised intensity (orange), perpendicular polarised intensity (blue). Inset: Depolarisation ratio.
Surface-Enhanced Raman Scattering (SERS) is a method for enhancing Raman signals. Samples of interest are brought in proximity or attached to a roughened metal surface with nanoscale features. The excitation laser interacts with plasmons on the surface of the metal, resulting in significantly increased Raman signals.
Metal colloids with the use of a suitable aggregating agent are common materials for SERS. The signal progression with time can be monitored to understand when the maximum signal is reached.

Figure 2: Raman spectrum of 1,2(4-pyridyl)ethylene 40 nm Au, recorded over time, showing the significant enhancement of the signal intensity of this SERS sample.
The 5-position grating turret of the RM5 can be equipped with gratings for a variety of measurements. Low groove density gratings provide measurements over a broad spectral range with lower resolution; whereas high groove density gratings measure over a narrower range but with higher resolution.
To measure high resolution spectra over a broad range an extended scan can be used. Ramacle seamlessly stitches the CCD data together to create a single spectrum which gives the advantage of both high resolution and broad spectral coverage.
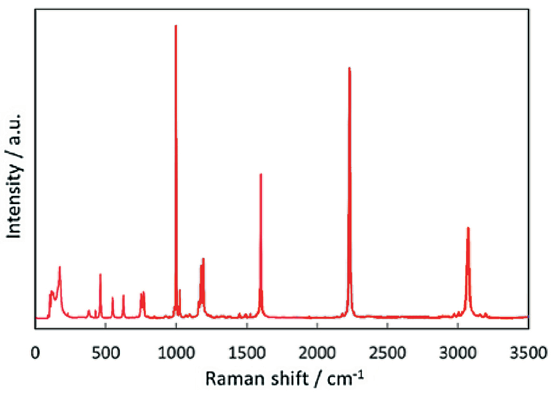
Figure 3: Benzonitrile, excited with 532 nm laser. Multiple spectra joined together. The resulting spectrum contains 6700 data points with 3500 cm-1 spectral coverage and a resolution of 0.54 cm-1 per pixel.
Some samples, in particular those that contain biological materials, can show a significant amount of background signal, often caused by fluorescence.
As fluorescence requires the presence of absorption (or resonant excitation), the amount of this unwanted background can be controlled by selection of an appropriate excitation wavelength.
The RM5 can have up to 3 different lasers fitted, allowing the user to optimise the excitation wavelength for the best Raman result with minimum background interference.

Figure 4: Paracetamol / Caffeine / Phenylephrine Hydrochloride tablet, excited with 638 nm laser (blue) and 785 nm laser (red).
Edinburgh Instruments’ RM5 Raman Microscope is designed for analytic and research purposes. The truly confocal design is unique to the market and offers uncompromised spectral resolution, spatial resolution, and sensitivity.
The RM5 builds on the expertise of robust and proven building blocks, combined with modern optical design considerations; and a focus on function, precision and speed. Easily learn more about our range of high performance instrumentation and discover the best Raman solutions for all research and analytical requirements.
Discover our RM5 Raman Microscope here.
If you have enjoyed this article on Raman Spectroscopy and Measurement Examples, why not take a moment to sign up to our monthly eNewsletter below for further updates on our latest research, application notes and products. Find us on Facebook, Twitter, and LinkedIn.