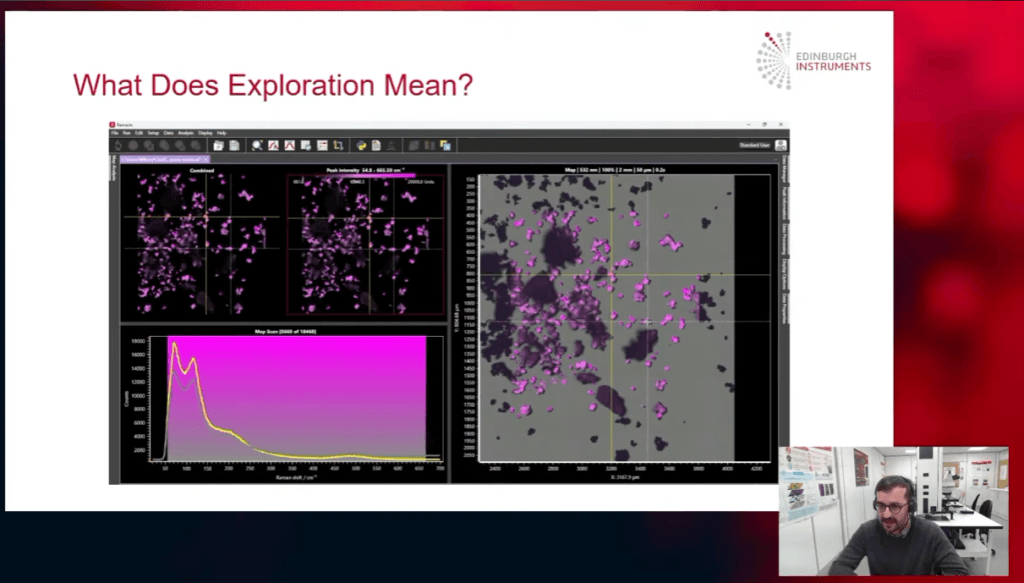
Raman microscopy combines chemical specificity with spatially resolved measurements, making it a powerful tool for characterising complex and heterogeneous materials. However, Raman maps can contain enormous quantities of spectral information. In one example from the webinar, a single map contained 18,640 spectra with 2,000 data points each, resulting in more than 37 million individual data points.
In this Edinburgh Instruments webinar, Grant Cumming and Dr Matthew Berry explore how chemometrics and multivariate analysis can automate Raman imaging, moving beyond manual peak picking to extract meaningful chemical information from complex datasets.
Chemometrics uses mathematical methods to uncover patterns and chemical information within large, high-dimensional datasets. The webinar considers three key analytical goals: exploration, segmentation and quantification.
Principal component analysis (PCA) provides an objective way to explore Raman maps by identifying the dominant sources of spectral variation. PCA analyses every spectrum simultaneously and produces principal components that can be mapped spatially, helping researchers identify chemically distinct regions without deciding beforehand what features to search for.
For more complex datasets, t-distributed stochastic neighbour embedding (t-SNE) offers a complementary approach. While PCA is linear, t-SNE can reveal more clearly defined spectral populations and boundaries that may otherwise appear as continuous variation. Together, the two techniques provide complementary ways to explore unknown or heterogeneous samples.
When the aim shifts from exploring variation to identifying discrete chemical populations, K-means clustering can automatically group spectra according to their similarity. The result is a spatially resolved Raman map in which pixels are assigned to chemically distinct clusters, without requiring prior peak selection.
The webinar demonstrates this approach using tungsten disulfide with regions of different layer numbers. K-means distinguishes the different Raman signatures and maps the resulting clusters spatially. A silhouette score can also be used to assess cluster separation and automatically select an appropriate number of clusters.
Where the chemical components are already known, non-negative least squares (NNLS) takes Raman analysis a step further by estimating their contribution at each pixel. Each measured spectrum is modelled as a linear combination of reference spectra, with a non-negativity constraint that prevents physically unrealistic negative component contributions.
Applied to a complex battery electrode, the approach produces chemical distribution maps for multiple phases alongside a residual map, providing a way to assess how well the proposed compositional model explains the experimental Raman data.
Watch the full webinar to hear Grant Cumming and Dr Matthew Berry demonstrate how PCA, t-SNE, K-means clustering and NNLS can streamline Raman microscopy data analysis, reveal hidden chemical variation and turn complex hyperspectral maps into clearer, actionable chemical information.