Upconversion nanoparticles (UCNPs) are inorganic crystalline nanostructures that exhibit photon upconversion, meaning that they absorb multiple long-wavelength photons to emit a shorter-wavelength photon. They are typically composed of a matrix such as NaYF4 doped with rare-earth ions, emitting visible luminescence upon NIR excitation. This property can be used in numerous applications such as biomedical imaging, sensing, and therapy. Exciting in the NIR is particularly useful in bioimaging as it reduces tissue autofluorescence and increases contrast. This, combined with high photostability, long emission lifetimes, and narrow emission bands, make UCNPs a strong candidate for next-generation imaging probes.
The design of UCNPs may be tailored to achieve specific photophysical properties. Size, morphology, and composition can all be varied by synthesis, yielding different emission spectra, upconversion quantum yield, and interactions with biomolecules. In practice, this potential is not fully realised as it is difficult to predict the detailed properties of novel UCNPs before synthesis and characterisation.
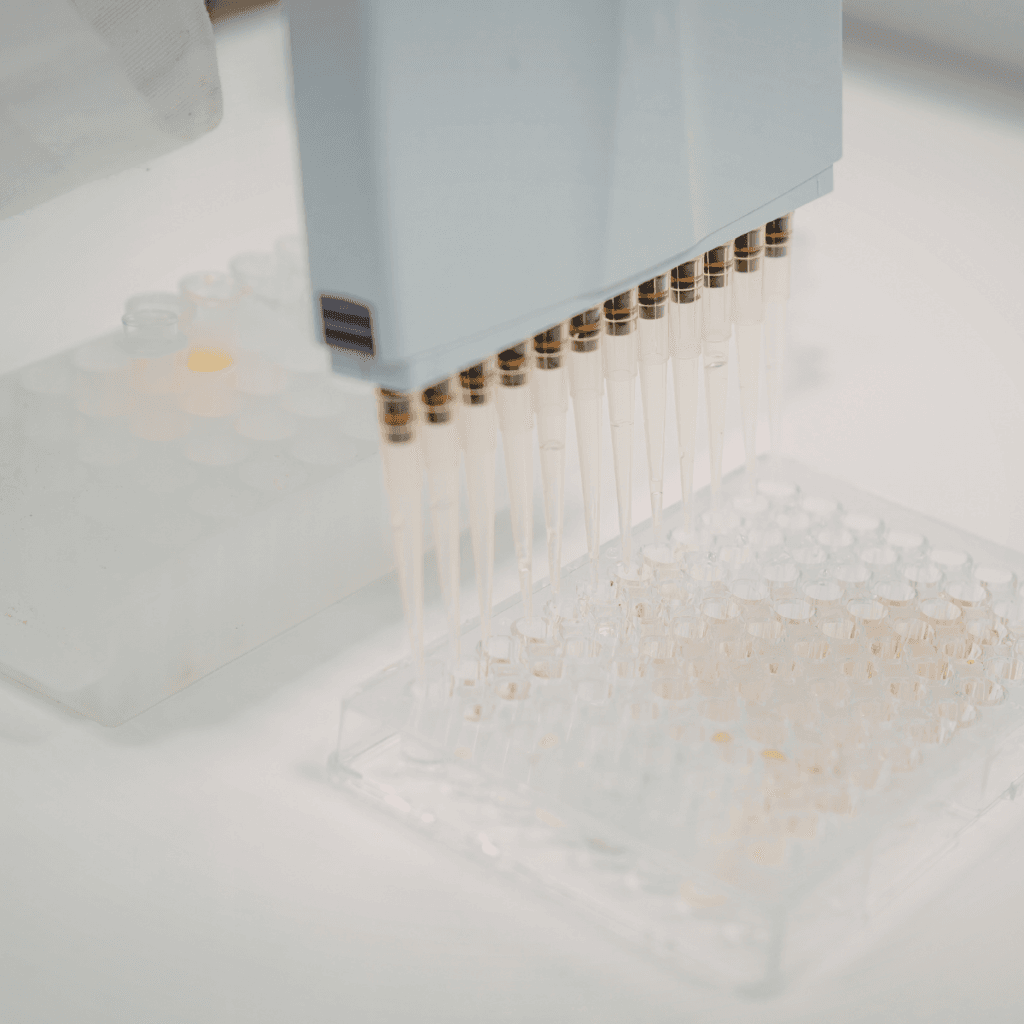
High-throughput synthesis methods, e.g. microwave reactors with autosamplers, enable preparation of >100 different samples per day, boosting the chances of finding the optimal UCNP composition for a particular application. This approach requires high-throughput analysis of their photoluminescence properties, including upconversion emission spectra, intensity, and time-resolved luminescence. This type of analysis can be carried out in a fluorescence microplate reader with spectral and time-resolved upconversion capability.
This Application Note demonstrates automated spectral and time-resolved upconversion measurements in the SC-41 Microplate Reader module of an FS5 Spectrofluorometer. High-throughput analysis of UCNPs accelerates the optimisation of their composition to meet specific functional requirements.
UCNP suspensions in deionised water were provided by the University of Strathclyde with the following compositions: (A) NaYF4:Yb,Er (20 mol% Yb3+, 2 mol% Er3+) and (B) NaYF4:Yb,Tm (20 mol% Yb3+, 2 mol% Tm3+), both coated with 25kDa polyethyleneimine (PEI). Particles were redispersed by vortexing prior to measurements. Samples were measured in an FS5 spectrofluorometer (Figure 1) equipped with a 2 W 980 nm laser for excitation, which was operated in continuous mode for spectral and pulsed mode for lifetime measurements. A visible photomultiplier tube (PMT980) was used for detection. Upconversion decays were acquired with multichannel scaling (MCS) electronics in the FS5.
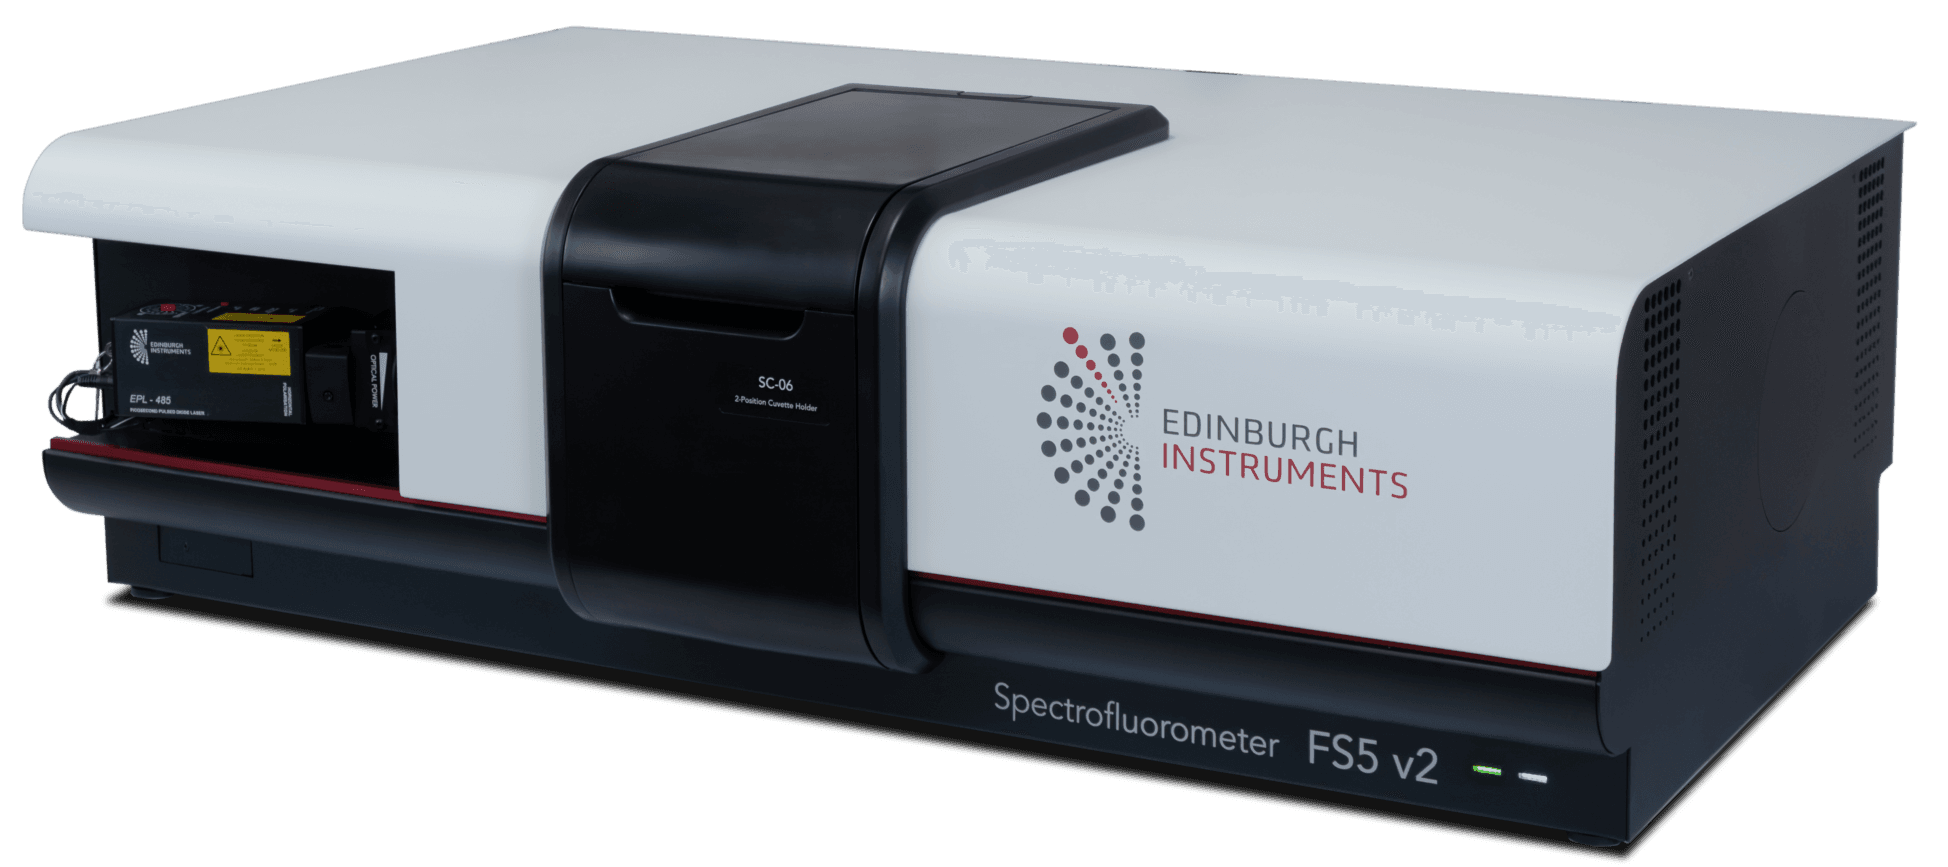
Figure 1. FS5 spectrofluorometer.
Solutions were placed in quartz cuvettes and measured in the SC-05 Standard Cuvette Holder or pipetted into a 96-well microplate (black, polystyrene, opaque bottom) for measurements in the SC-41 Microplate Reader module. For microplate reader measurements, 200 μL of the sample solution was pipetted into each well following the layout in Figure 2. A longpass filter was placed in the excitation path to remove unwanted emission bands from the laser, and a 950 nm shortpass filter was placed in the emission path to filter out scattered 980 nm light.
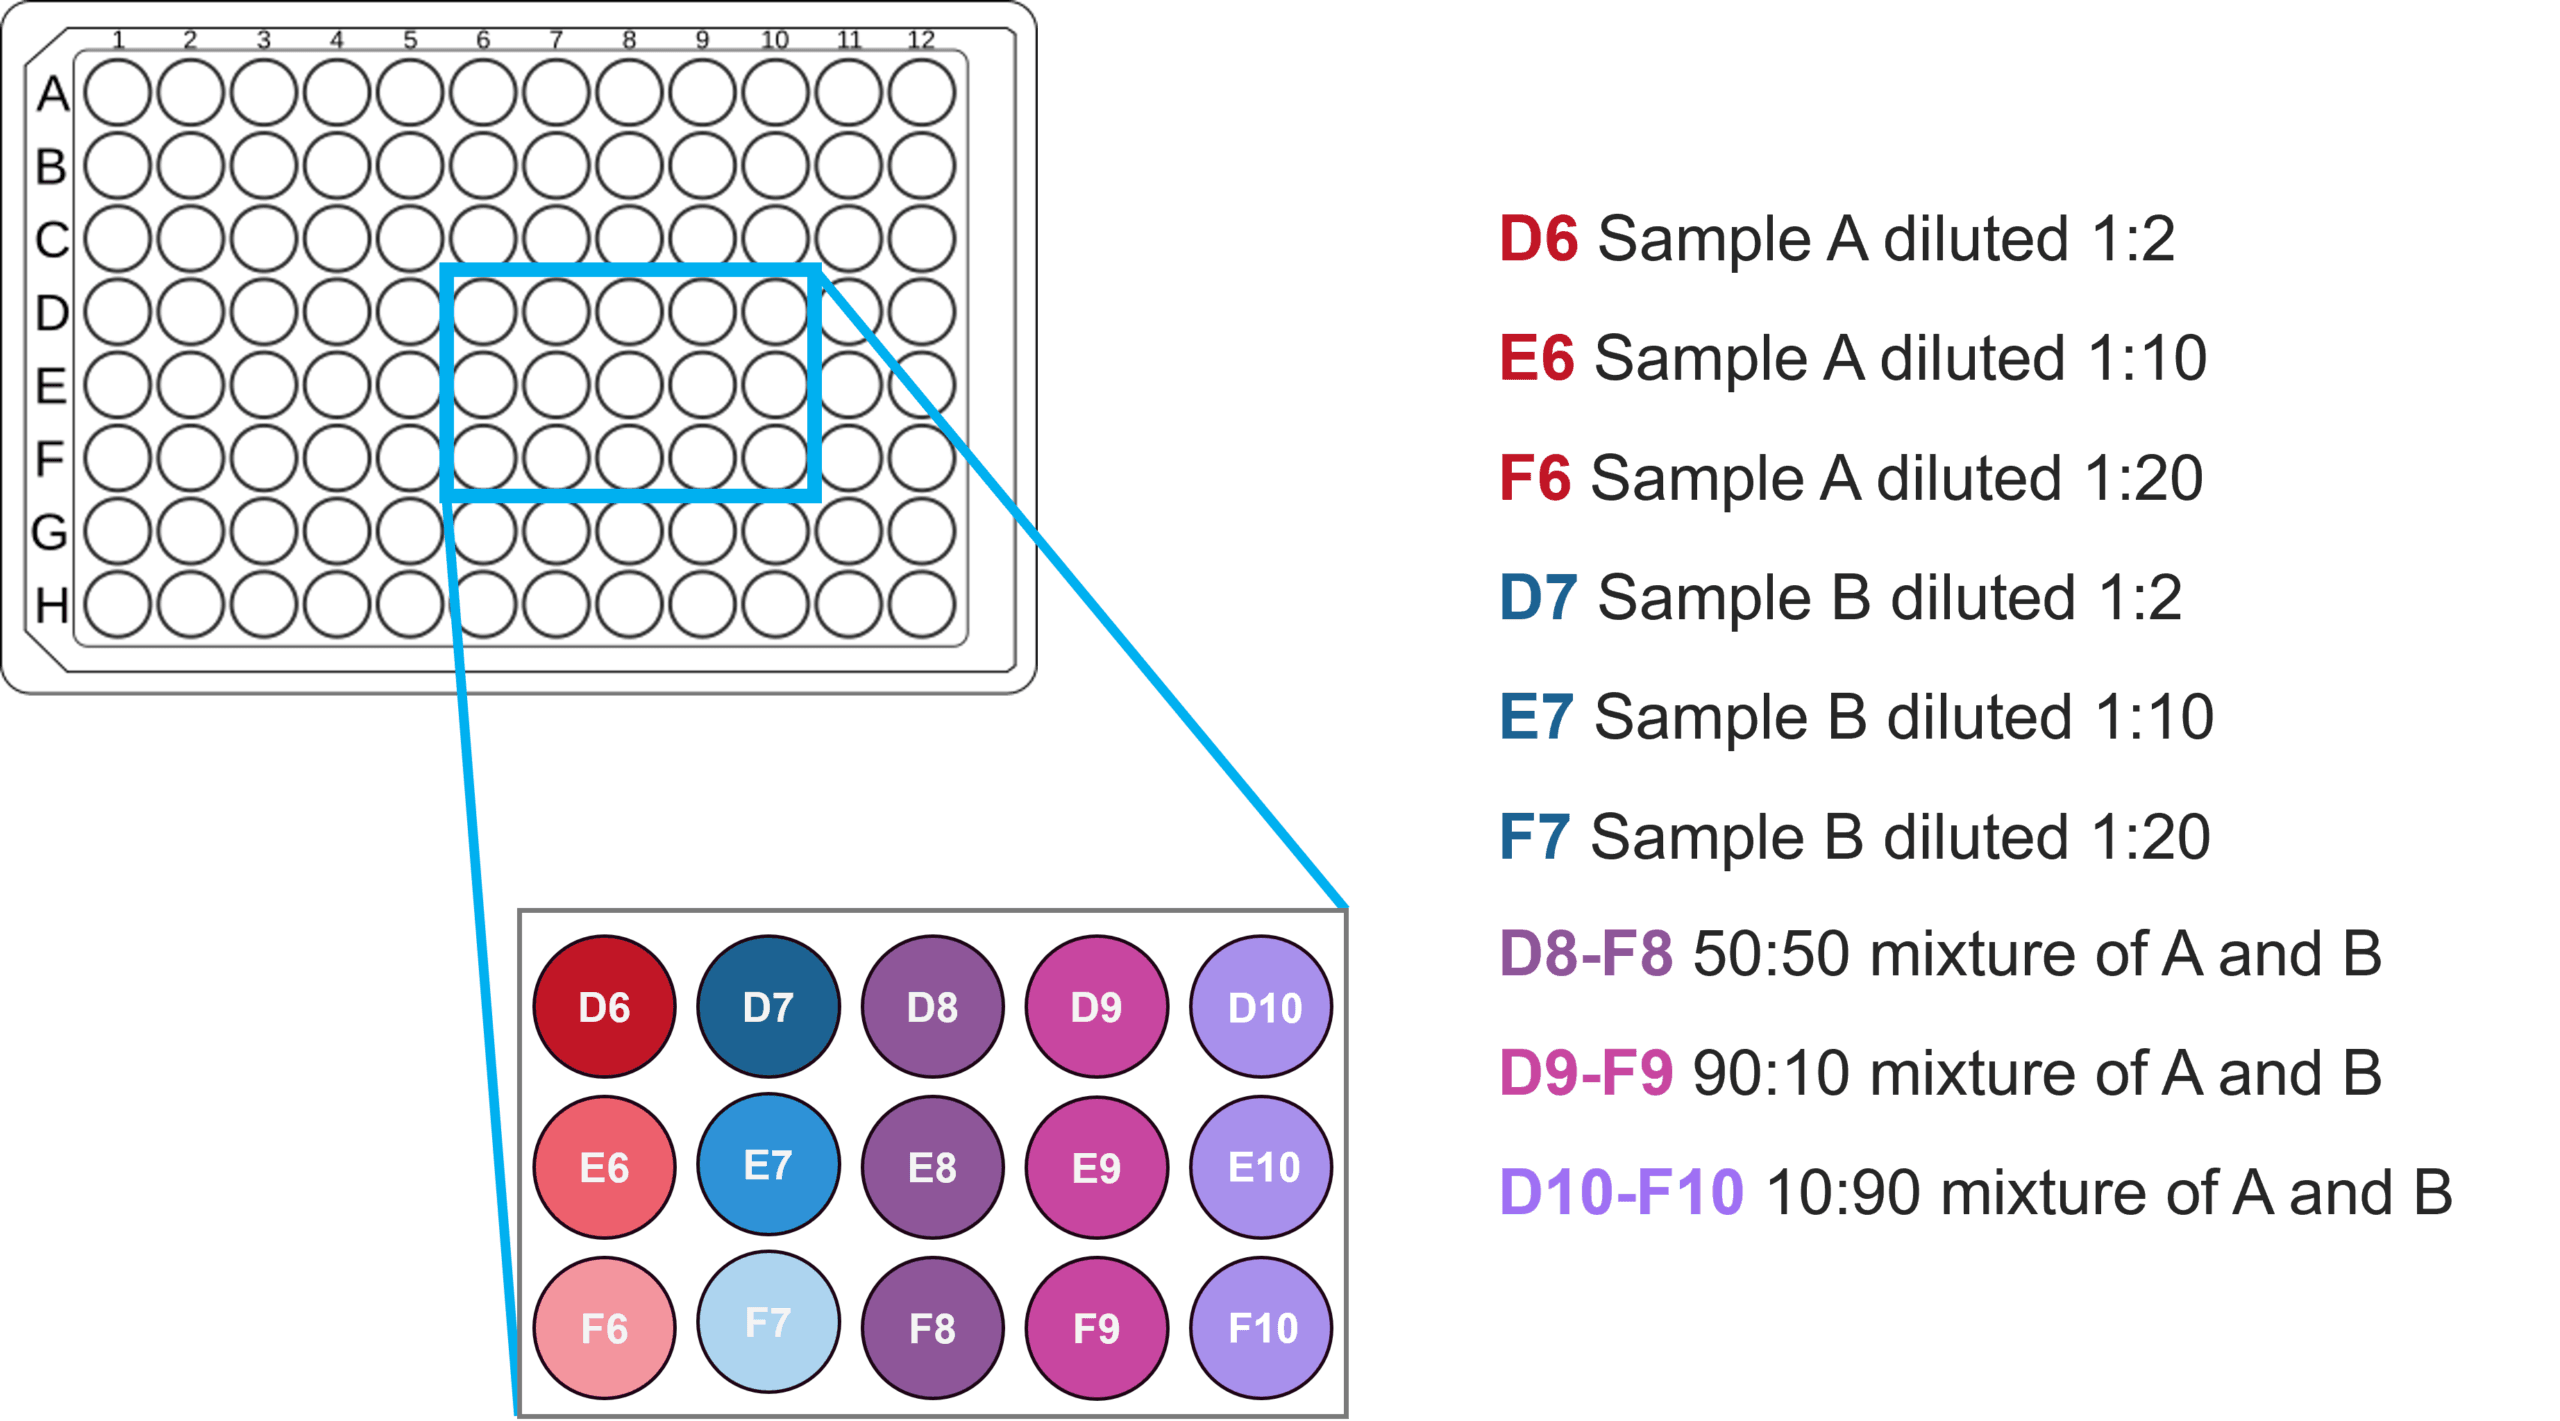
Figure 2. Plate reader layout detailing solutions and mixtures pipetted into each well.
Samples A and B were measured in cuvettes before the plate reader experiments to obtain detailed upconversion spectra. The FS5 allows to easily switch between cuvette and microplate configurations, thanks to plug-and-play sample modules. Figure 3 presents upconversion spectra for both samples acquired at varying excitation laser power. The spectra present characteristic emission bands from Er3+ and Tm3+ along with a nonlinear dependence of intensity on excitation power, which is typical of upconversion.
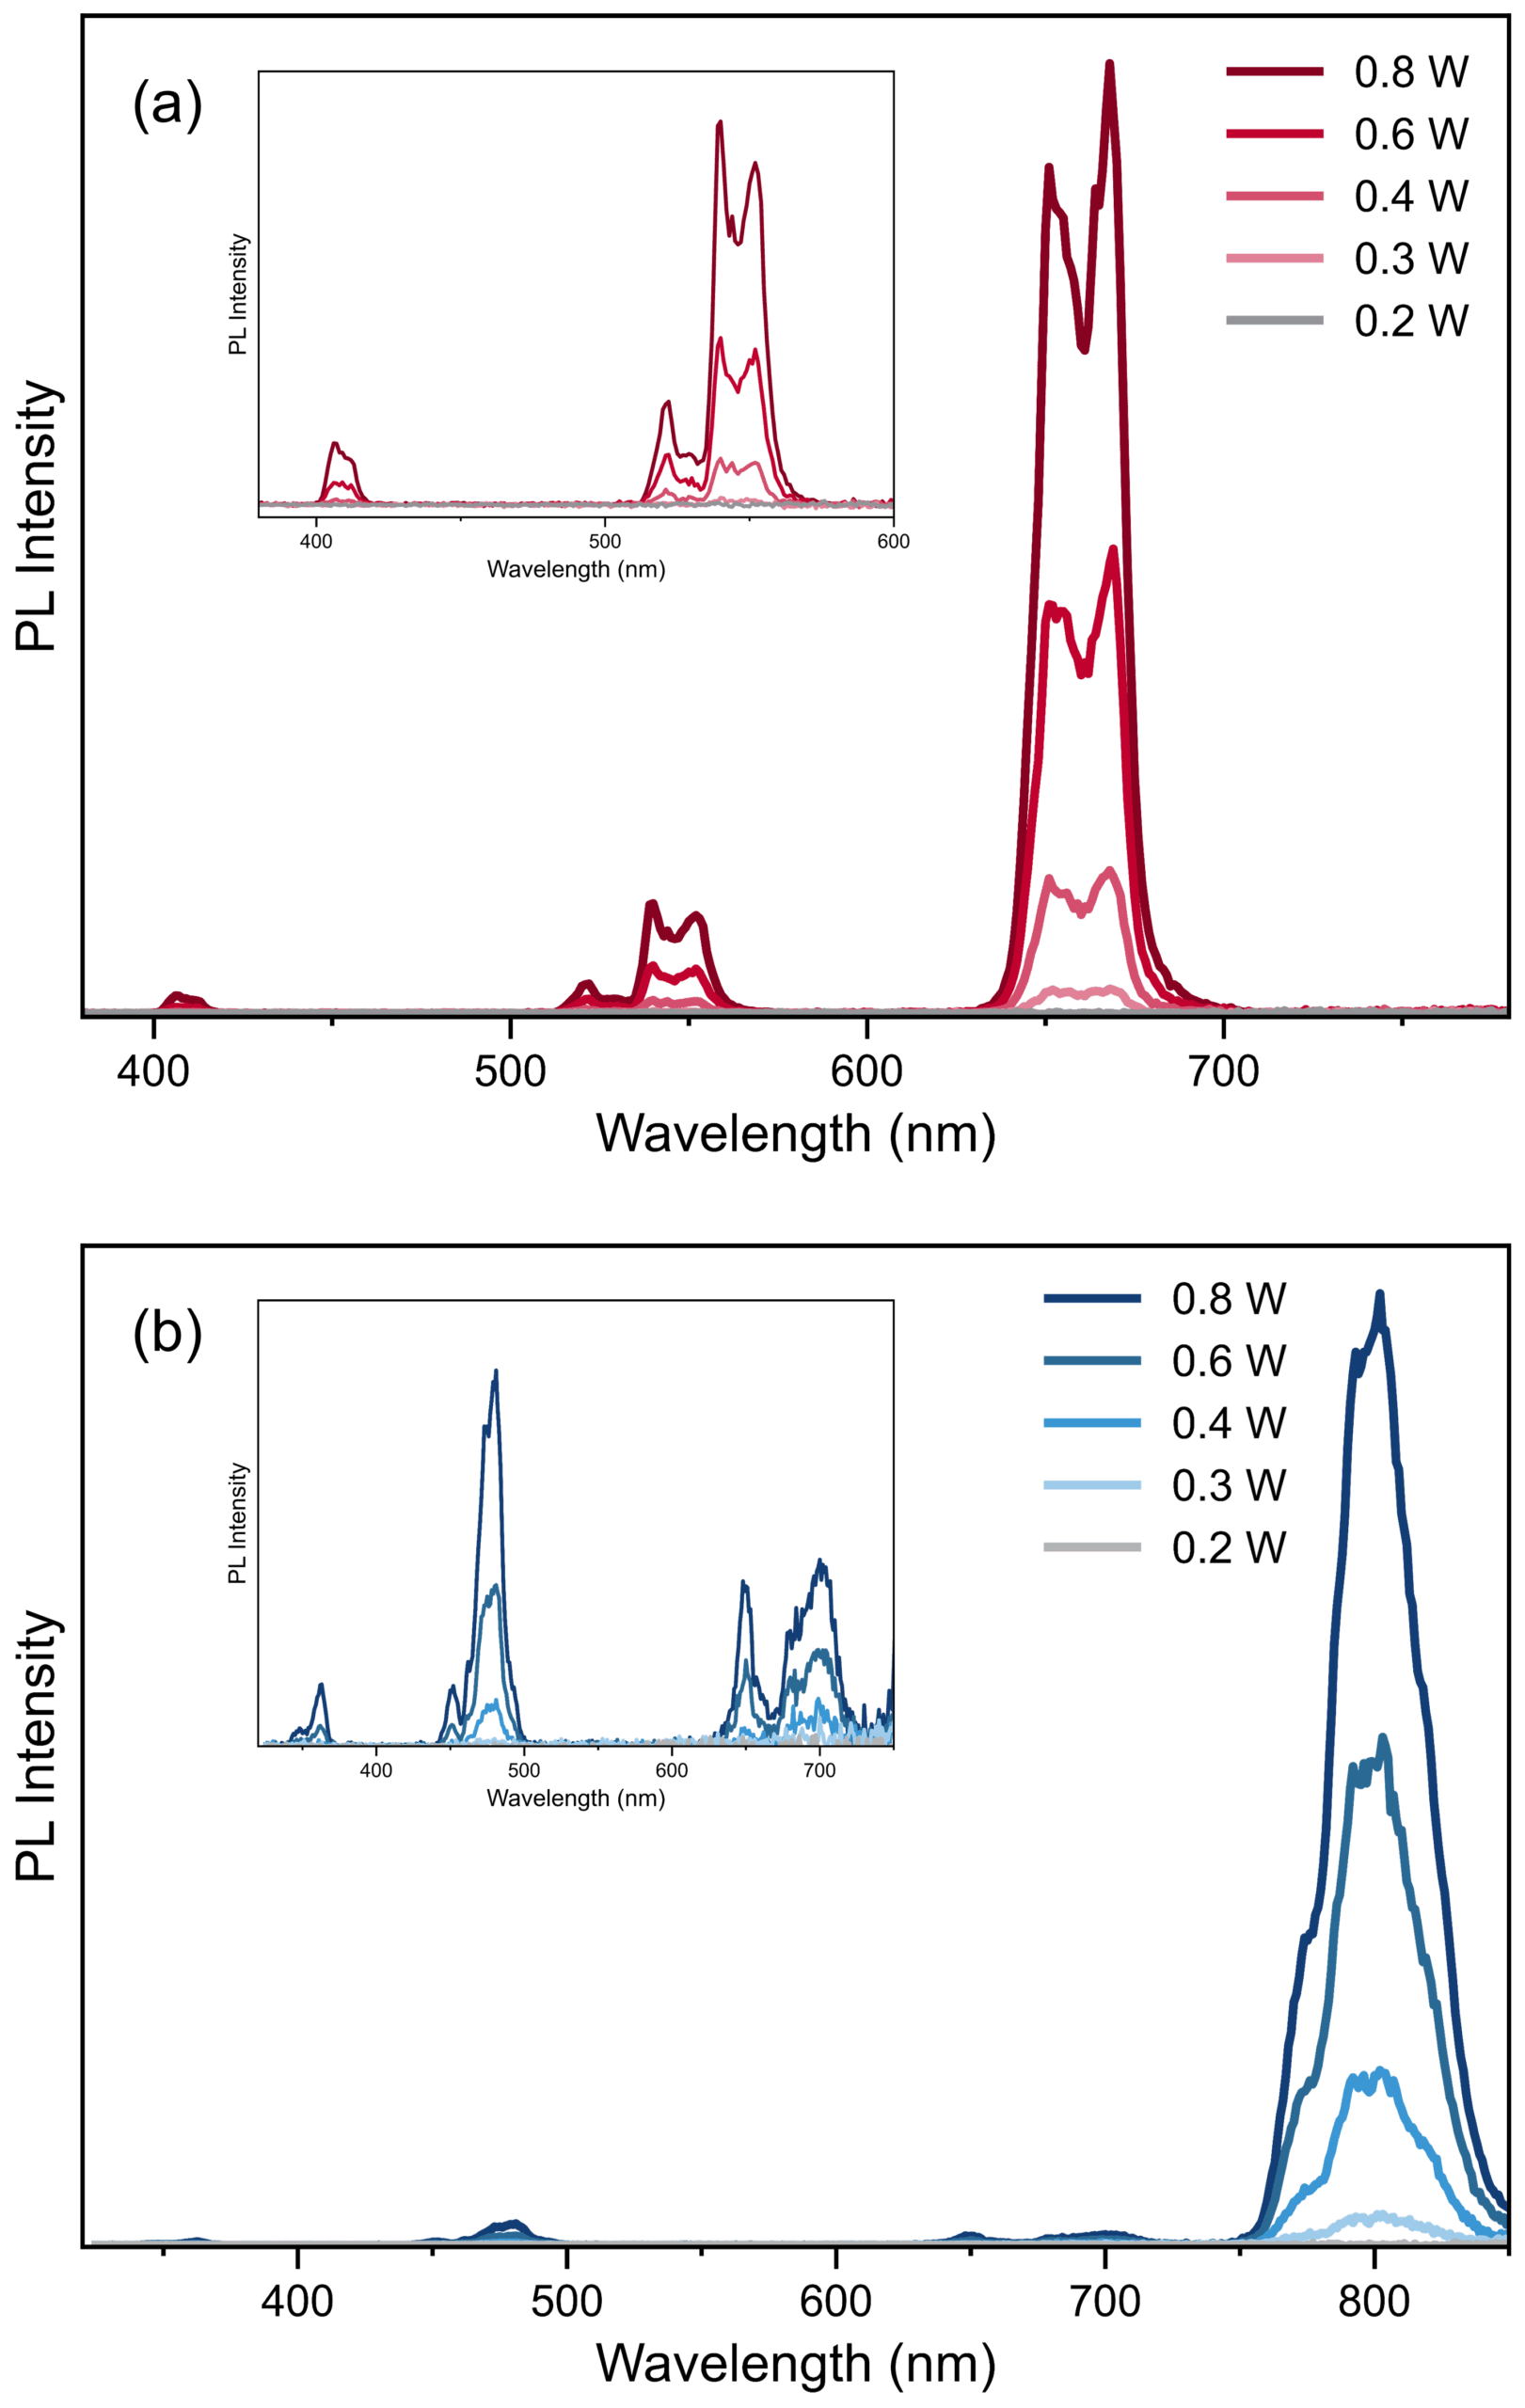
Figure 3. Upconversion PL spectra in cuvettes from (a) Sample A and (b) Sample B measured in cuvettes at varying excitation power. Excitation wavelength = 980 nm, Emission bandwidth = 1 nm, Step size = 1 nm, Dwell time = 0.1 s/step. Insets for (a) and (b) show magnification of spectra from 375 – 775 nm and 325 – 850 nm, respectively.
Sequences of samples were automatically measured with the SC-41 plate reader accessory. Example spectra are shown in Figure 4, where a series of dilutions of Samples A and B were characterised using the same parameters in a single acquisition. In addition, Figure 5 shows upconversion spectra for mixtures of A and B. Despite giving a lower signal than the bulk solutions, UCNPs were easily measurable in a microplate thanks to the spectrometer’s photon-counting detection. If studying a full 96-well microplate, this setup can save hours of experimental time compared to measuring bulk solutions in cuvettes.
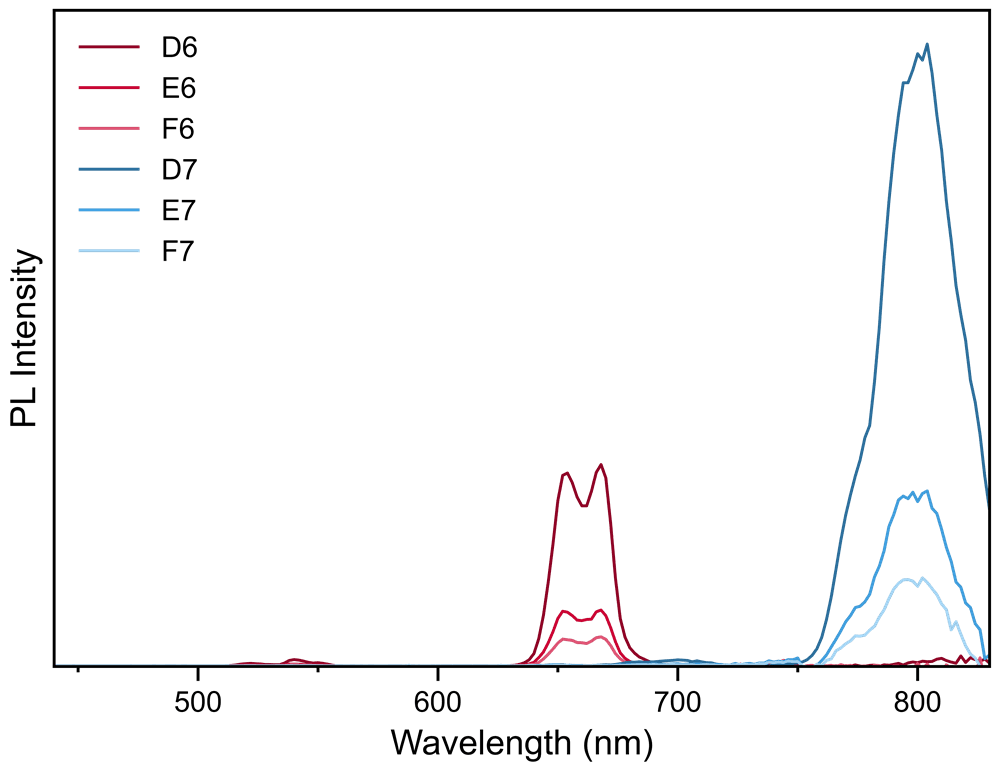
Figure 4. Upconversion spectra in a microplate reader. Sample A diluted 1:2, 1:10, and 1:20 (D6, E6, F6) and Sample B diluted 1:2, 1:10, and 1:20 (D7, E7, F7). Excitation wavelength = 980 nm, Excitation power = 1.6 W, Emission bandwidth = 5 nm, Step size = 2 nm, Dwell time = 0.5 s/step.
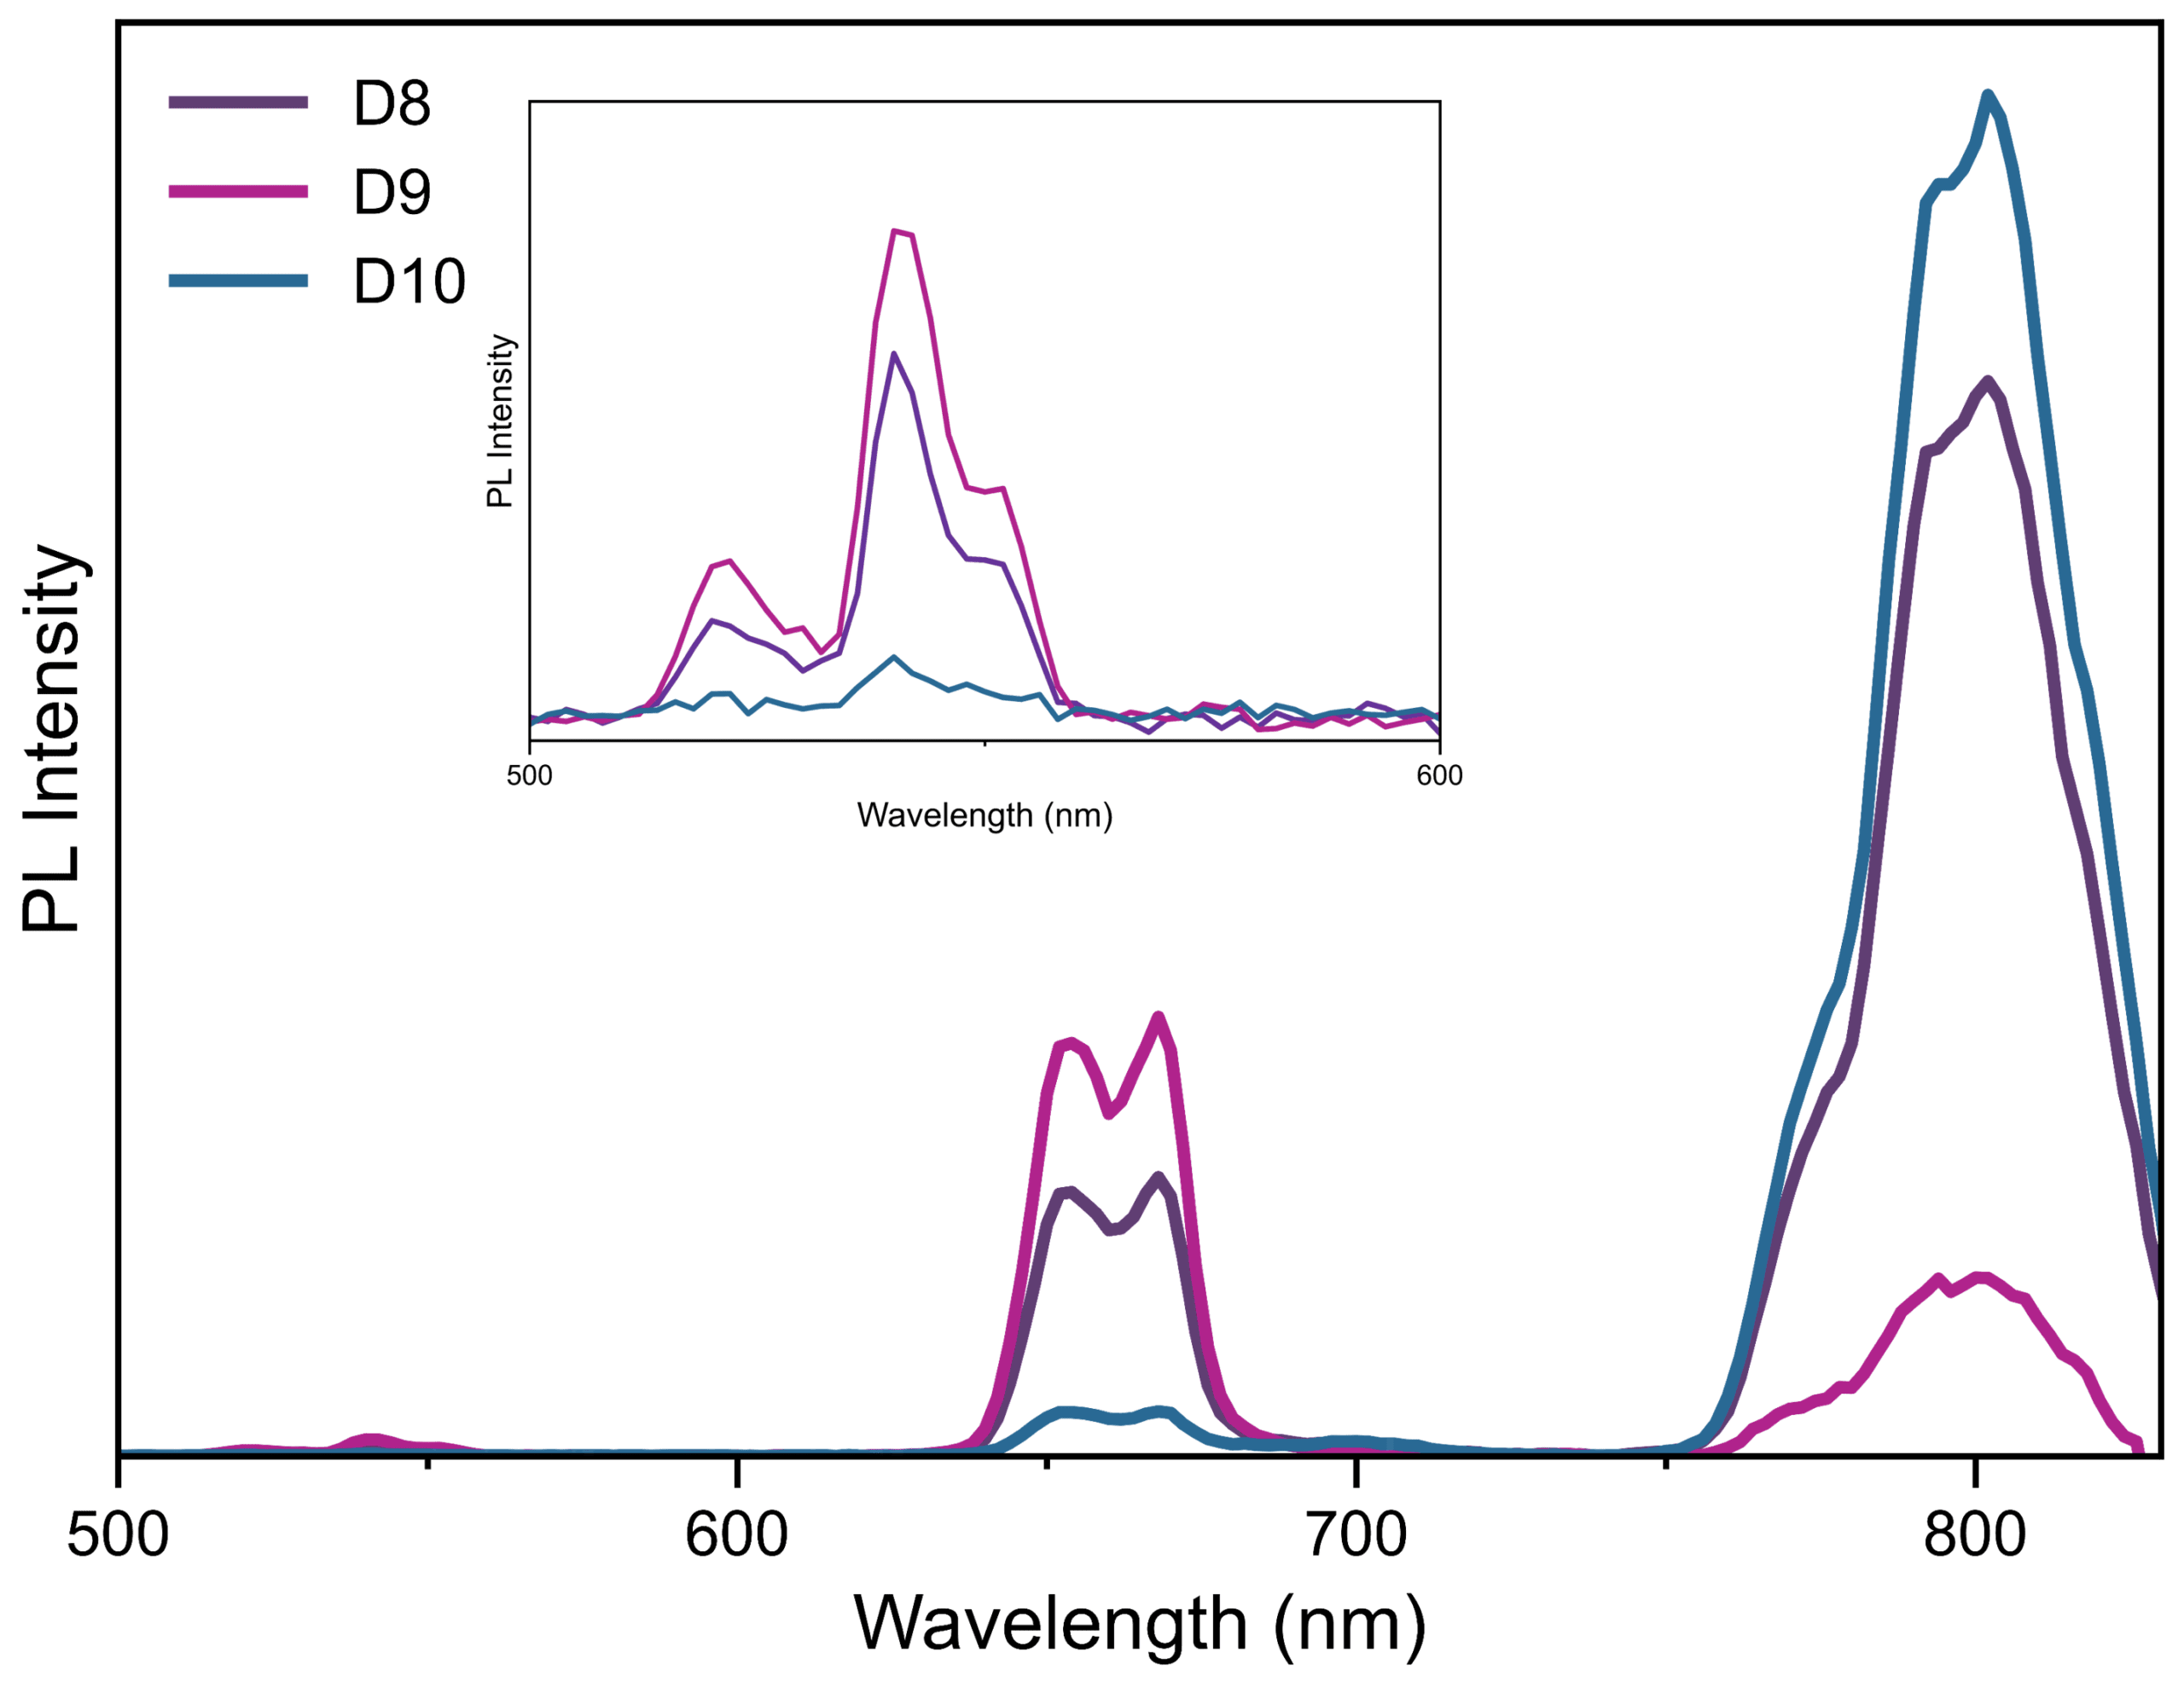
Figure 5. Upconversion spectra in a microplate reader from mixtures of Samples A and B in wells D8, D9, and D10. Excitation wavelength = 980 nm, Excitation power = 1.6 W, Emission bandwidth = 5 nm, Step size = 2 nm, Dwell time = 1 s/step. Inset shows magnification of spectra between 500 – 600 nm.
The SC-41 plate reader enables time-resolved upconversion measurements using a pulse module for the 980 nm laser and MCS electronics. Example decays can be seen in Figure 6. The samples were excited with square pulses of 100s of microseconds, and the results were fitted to a single-exponential decay in the Fluoracle software.
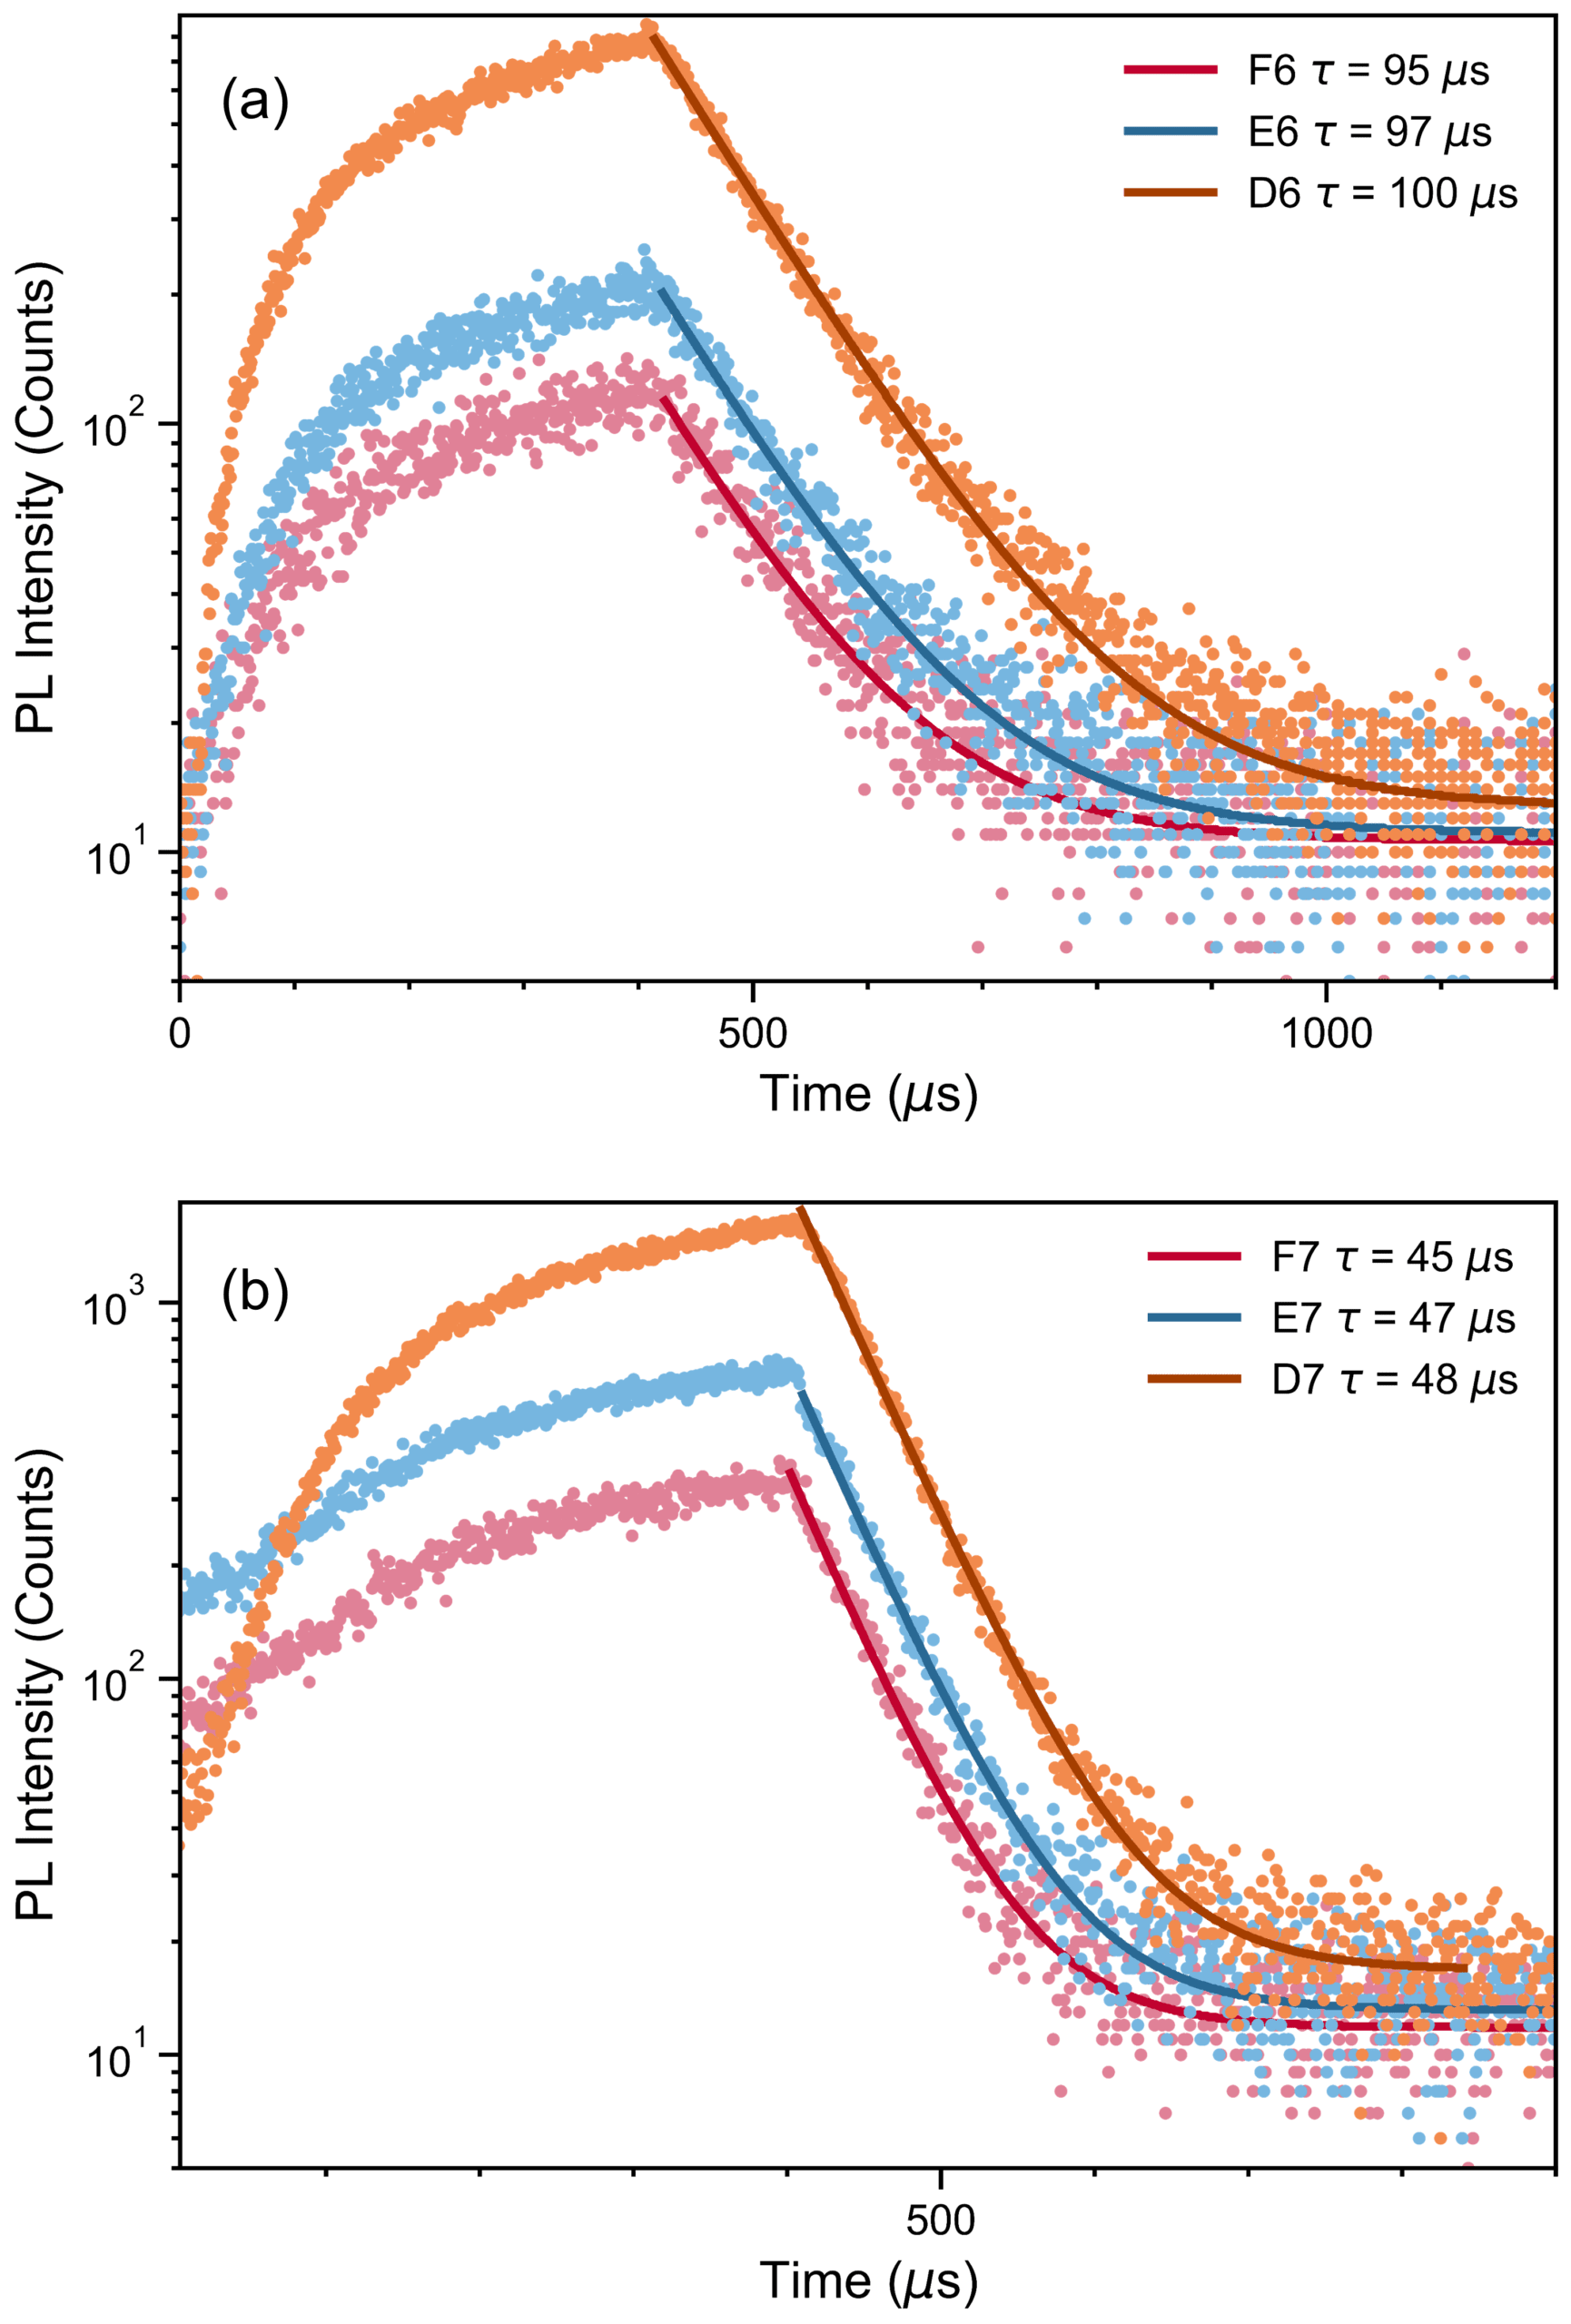
Figure 6. Upconversion decay and exponential tail fit result from (a) Sample A diluted 1:2, 1:10, and 1:20 (D6, E6, F6) at 665 nm and (b) Sample B diluted 1:2, 1:10, and 1:20 (D7, E7, F7) at 790 nm. Excitation wavelength = 980 nm, Emission bandwidth = 10 nm, Acquisition time = 2 minutes per well. Fit results are indicated in the graphs.
An upconversion plate reader can streamline UCNP research by enabling high-throughput characterisation of nanoparticles. The Edinburgh Instruments FS5 spectrofluorometer equipped with an SC-41 Microplate Reader module is the only commercial instrument capable of measuring both spectra and lifetimes of UCNPs in a microplate, providing detailed insights into their photophysics to optimise the design of next-generation upconversion materials.
We are grateful to John Neil, Rebecca McGonigle, and Lewis E. MacKenzie (University of Strathclyde) for synthesising the UCNP samples and providing advice on the experiments.