Skip to content
Skip to content
  • News
  • Events
  • eBooks
  • Blog
  • Careers
  • Contact
  • News
  • Events
  • eBooks
  • Blog
  • Careers
  • Contact
KNOWLEDGEBASE
  • About Us
  • Products

    Fluorescence Spectrometers

    • FLS1000 Photoluminescence Spectrometer
    • FS5 Spectrofluorometer
    • LifeSpec II Lifetime Spectrometer
    • Mini-tau Lifetime Spectrometer

    Raman Microscopes

    • RM5 Raman Microscope
    • RMS1000 Multimodal Confocal Microscope

    Transient Absorption

    • LP980 Transient Absorption Spectrometer

    FTIR Spectrometers

    • IR5 FTIR Spectrometer

    Lasers and LEDs

    • Pulsed Lasers
    • Gas Lasers
    • Customisation Options
    View All Products
  • Techniques
  • Applications
KNOWLEDGEBASE
Edit Content
  • About Us
  • Products
  • Techniques
  • Applications
  • Knowledgebase
  • eBooks
  • News
  • Events
  • Blog
  • Careers
  • Contact Us

RESOURCES

Front-illuminated CCD or Back-Illuminated CCD: What is the Best Choice for Your Raman Microscope?

  • October 17, 2024

KEY POINTS

  • Back-illuminated CCDs are more sensitive than front-illuminated CCDs because they have a higher quantum efficiency. This results in a stronger Raman signal and better signal-to-noise ratios in your spectra.
  • Back-illuminated CCDs enable faster imaging because achieving the desired spectral quality takes less time. This is crucial if your samples are large or time-sensitive.
  • While generally the better detector, the back-illuminated CCD may not be the best choice in specific situations. The etaloning effect in back-illuminated CCDs can create unwanted artefacts in your spectra when using 785 nm or 830 nm lasers with low Raman scattering samples that require long acquisition times.
Edit Content

Back-illuminated charge coupled devices (CCDs) offer superior sensitivity and faster Raman imaging, making them ideal for most Raman applications. However, for specific experiments involving NIR lasers and low-scattering samples, front-illuminated CCDs may be the better option for avoiding etaloning in your spectra.

Introduction

In Raman microscopy, the choice of detector can significantly impact spectral quality. In this Technical Note, we compare the performance of front-illuminated (FI-CCD) and back-illuminated CCDs (BI-CCD) with respect to Raman spectral sensitivity and Raman imaging times. Due to its higher quantum efficiency (QE), the BI-CCD detects a higher Raman signal and has a higher signal-to-noise ratio than a FI-CCD. However, the etaloning effect observed when analysing low Raman scattering samples with 785 nm and 830 nm lasers means the BI-CCD may not always be the best choice.

Quantum efficiency curves for the FI-CCD and BI-CCD
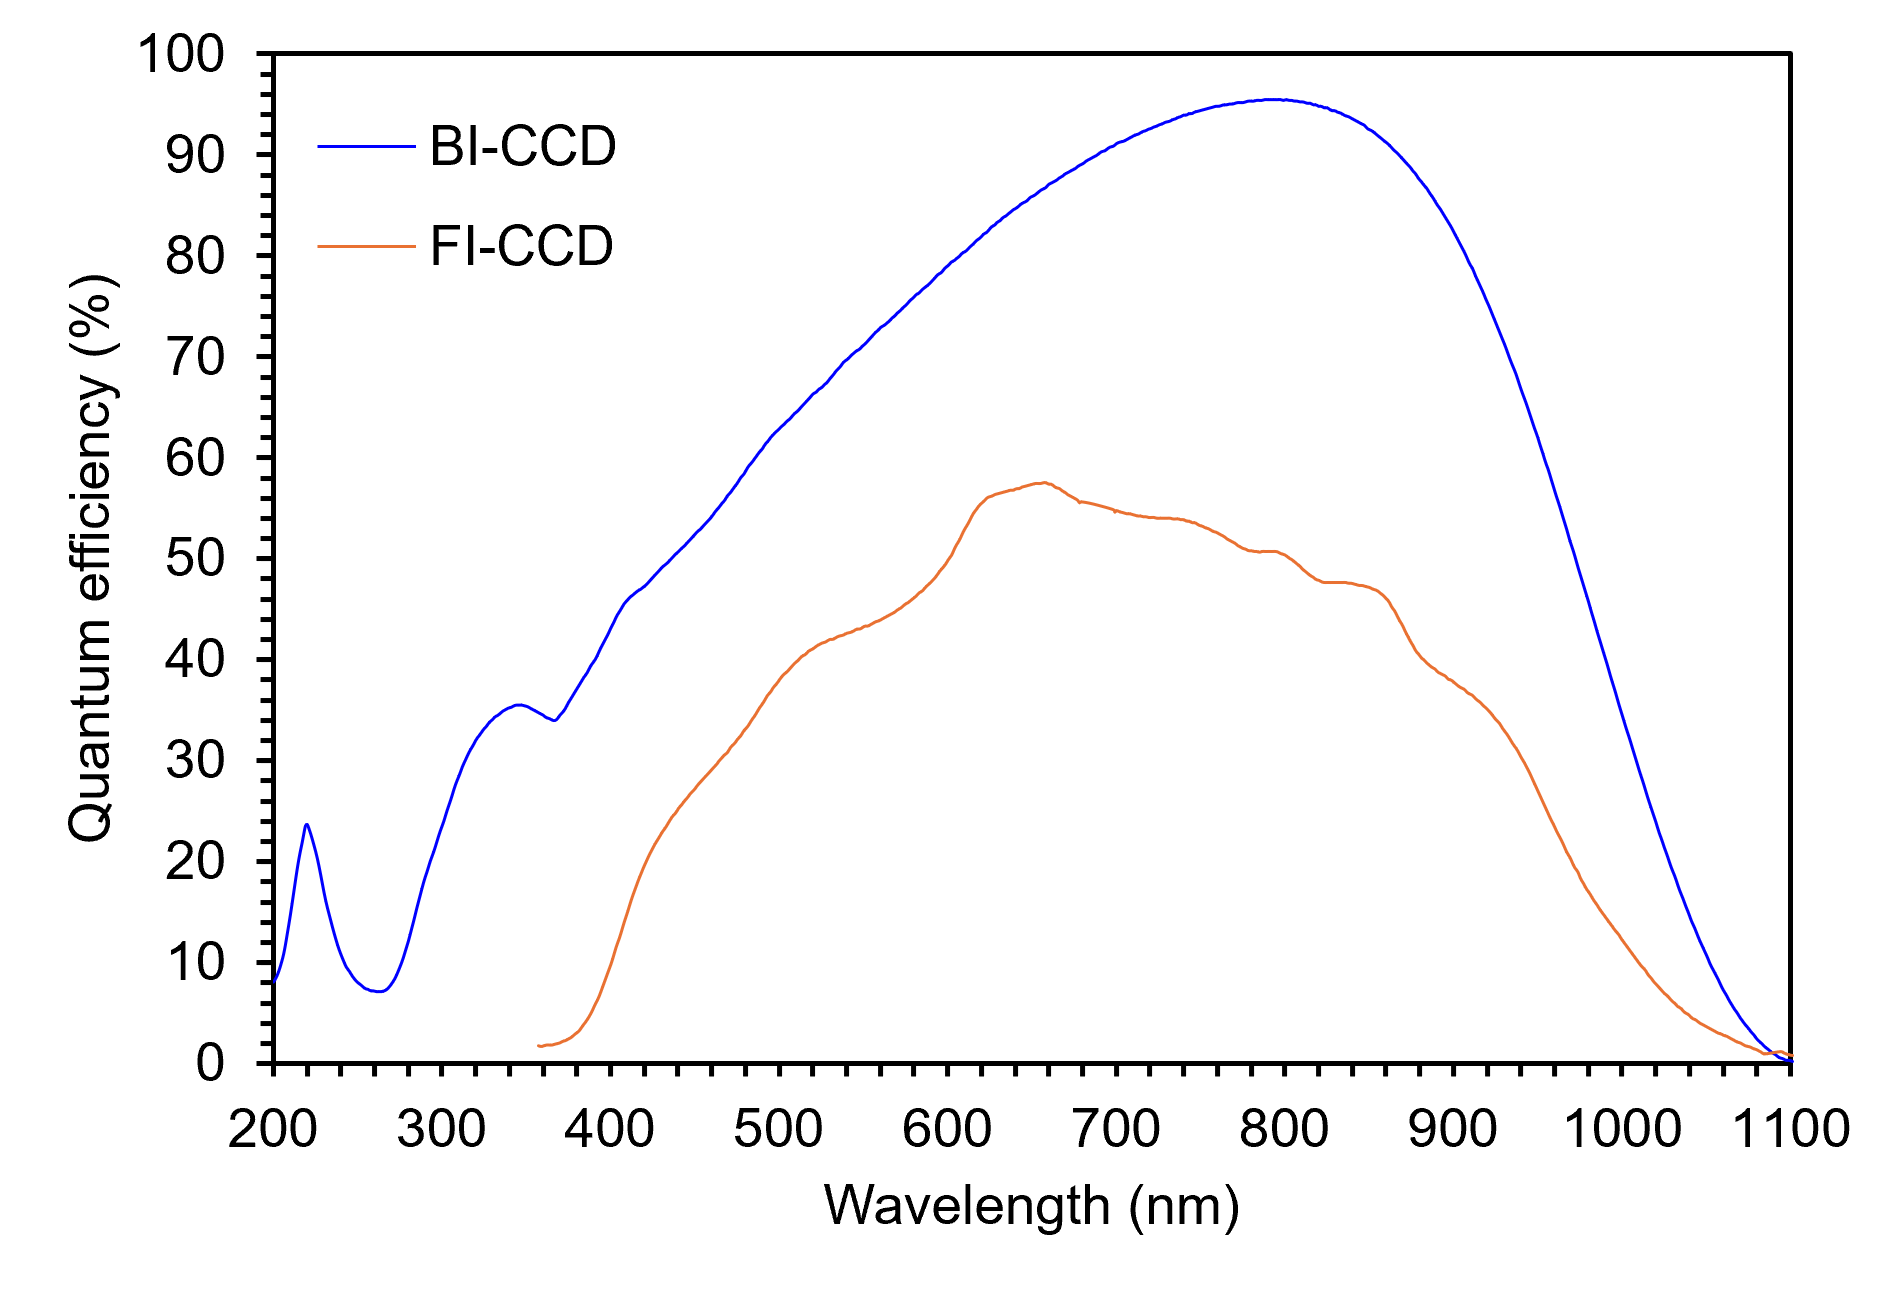
Figure 1. Quantum efficiency curves for the FI-CCD and BI-CCD.

Effect of CCD on Spectral Sensitivity

The key metric when choosing a CCD for a Raman microscope is sensitivity. The QE and the noise of the CCD determine sensitivity. High QE and low noise result in high sensitivity. The higher the sensitivity, the shorter the acquisition time required to obtain a Raman spectrum of sufficient quality. To demonstrate the effect of the CCD on spectral sensitivity, Raman spectra were recorded from a silicon chip at excitation wavelengths of 532 nm, 785 nm, and 830 nm. The spectra were detected on an FI-CCD and a BI-CCD sequentially under equivalent conditions and acquisition times.

Figure 2 shows comparisons of the silicon spectrum measured on the two CCDs at three laser wavelengths. The Raman signal magnitude is higher on the BI-CCD at all laser wavelengths. This comparison shows that to achieve an equivalent spectrum quality (signal-to-noise ratio), the FI-CCD would require an acquisition time of approximately 3-5 times longer than the BI-CCD.

spectral sensitivity comparison of FICCD and BICCD
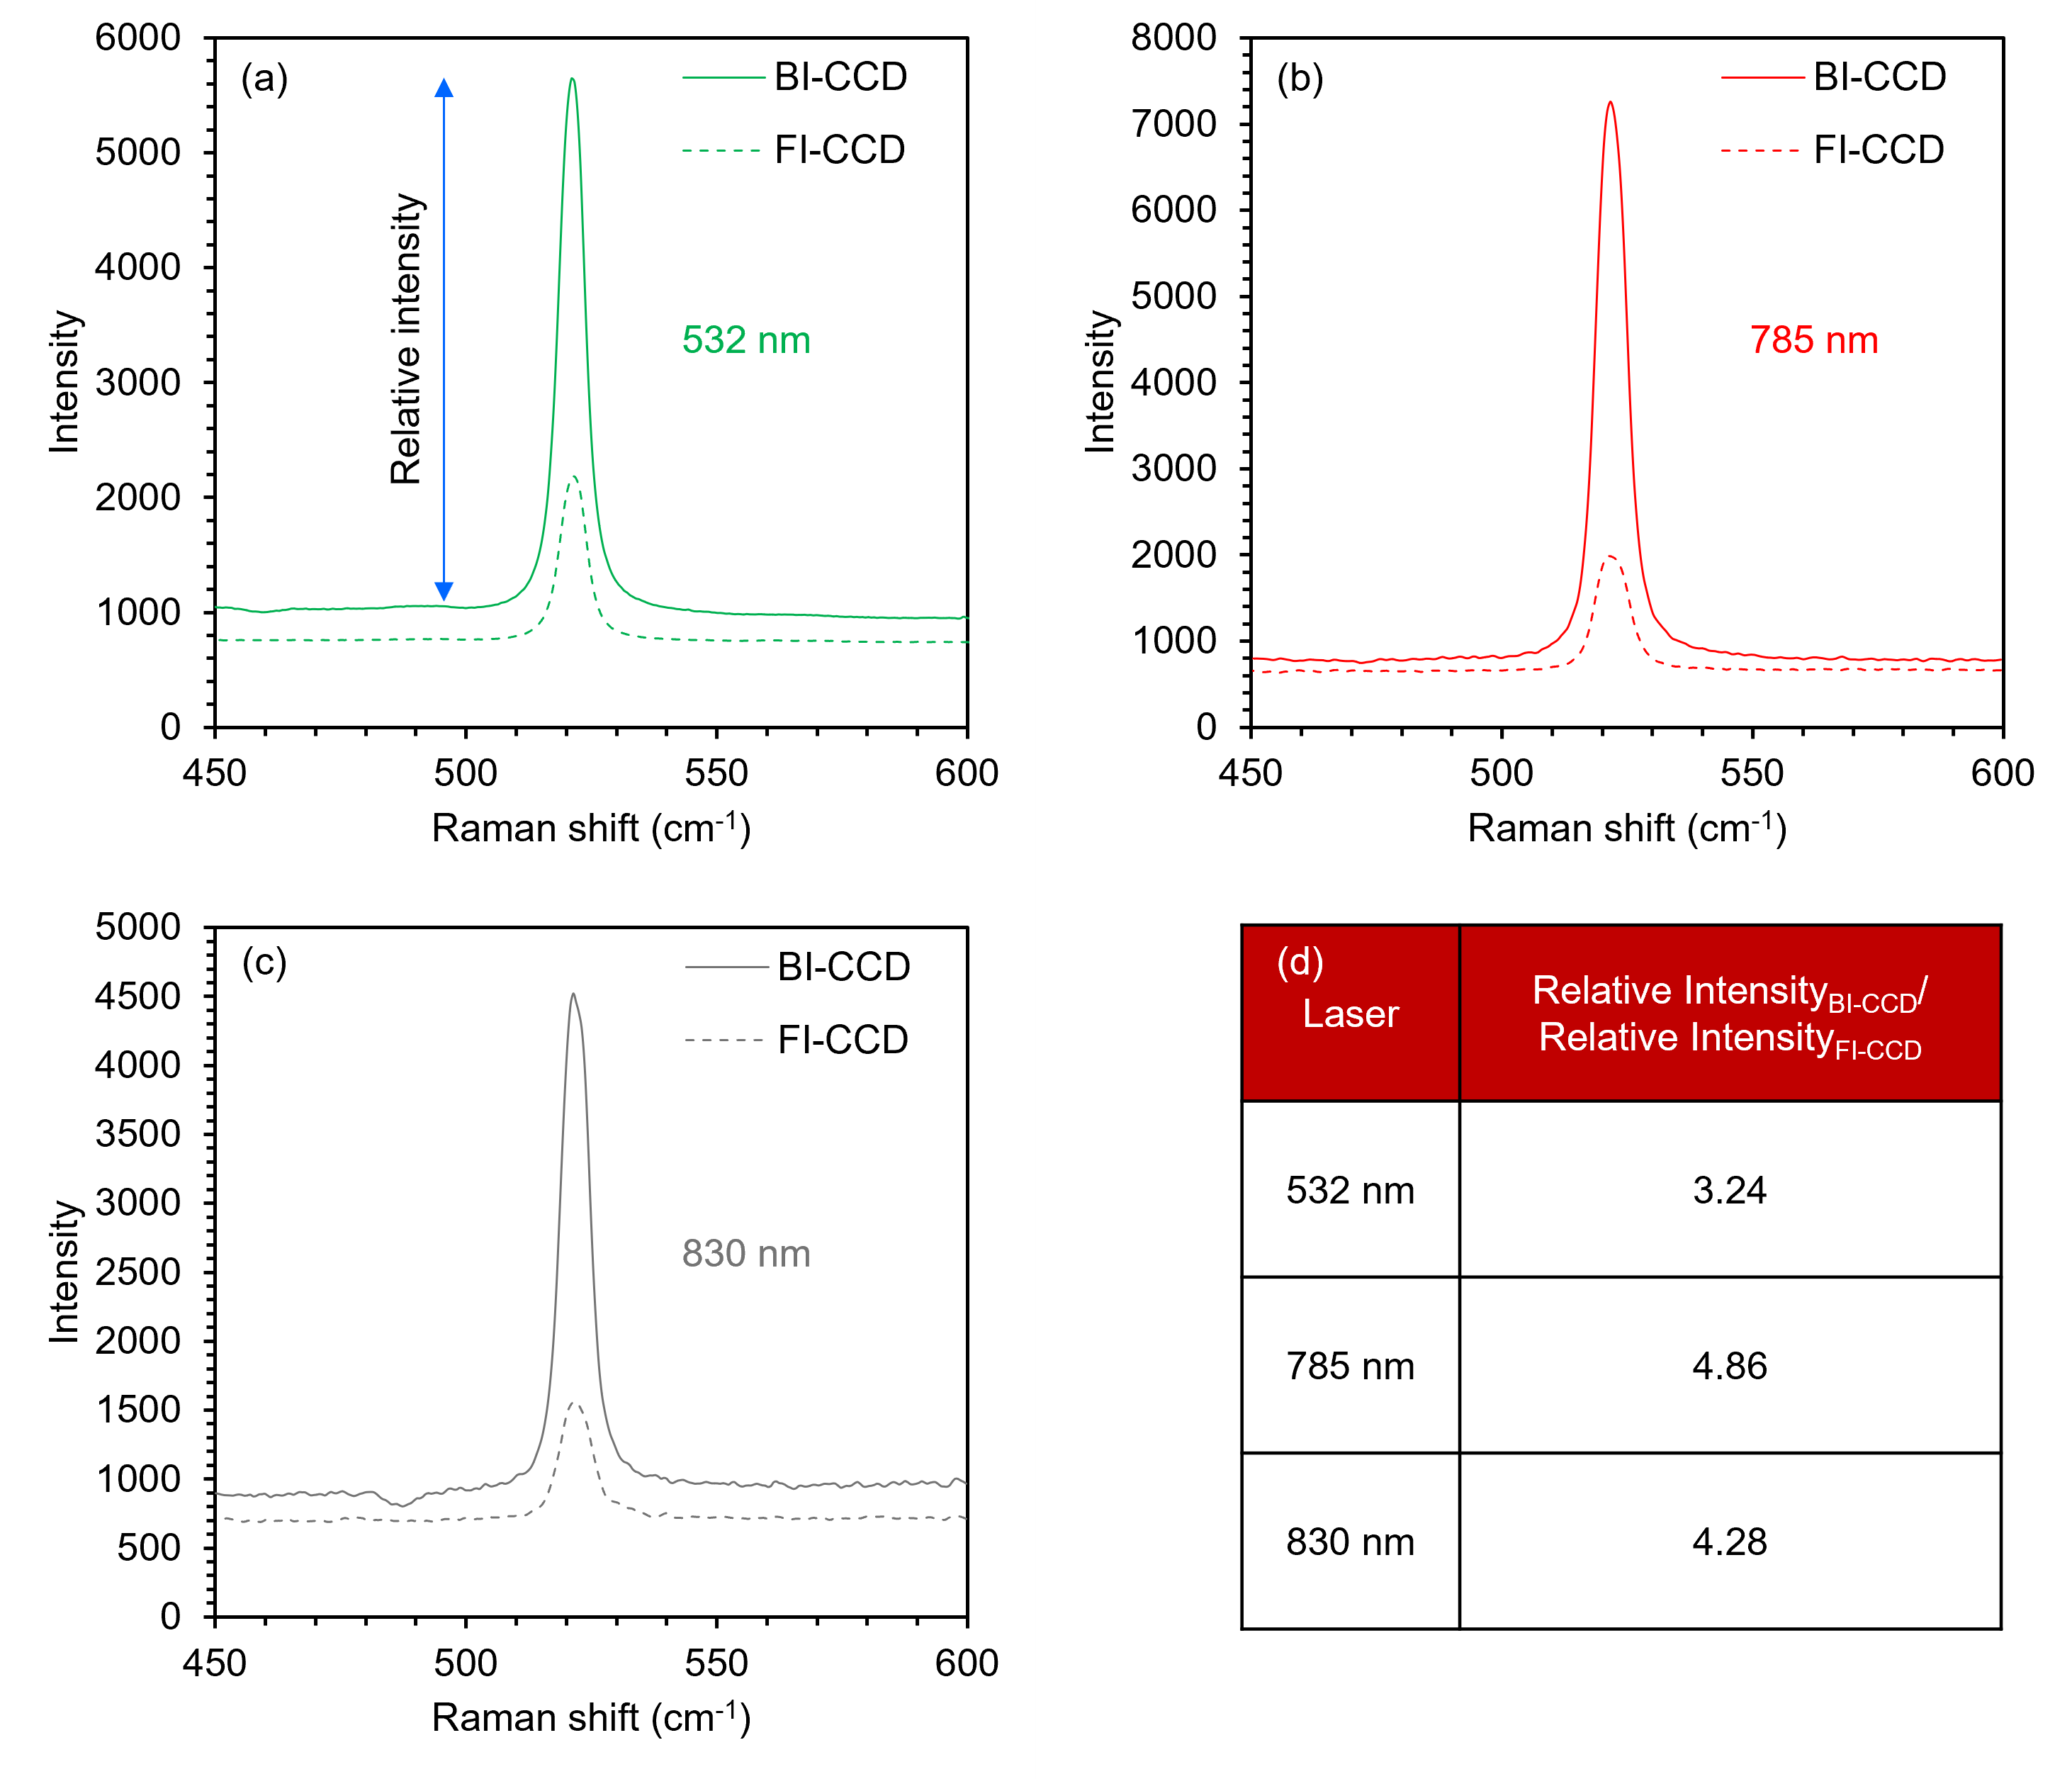
Figure 2. Raman spectral sensitivity measurements for the FI-CCD and BI-CCD recorded with 532 nm, 785 nm, and 830 nm excitation.

Effect of CCD on Raman Imaging Time

The difference in acquisition time to acquire an equivalent quality spectrum is particularly important for Raman imaging. To demonstrate the impact, a Raman image of a carbon nanotube sample was acquired on the BI-CCD and FI-CCD. Achieving a good-quality spectrum of the nanotube G+ band requires an acquisition time of approximately 0.2s per point on the BI-CCD and 0.5s per point on the FI-CCD (Figure 3a). Due to the difference in acquisition per point, the BI-CCD image (Figure 3b) took 50 minutes to acquire compared to 115 minutes for the FI-CCD (Figure 3c). The acquisition time per point on the FI-CCD could, of course, be reduced down to 0.2s to achieve the same total image acquisition time as the BI-CCD but at a loss of spectral quality.

 imaging speed comparison of FICCD and BICCD
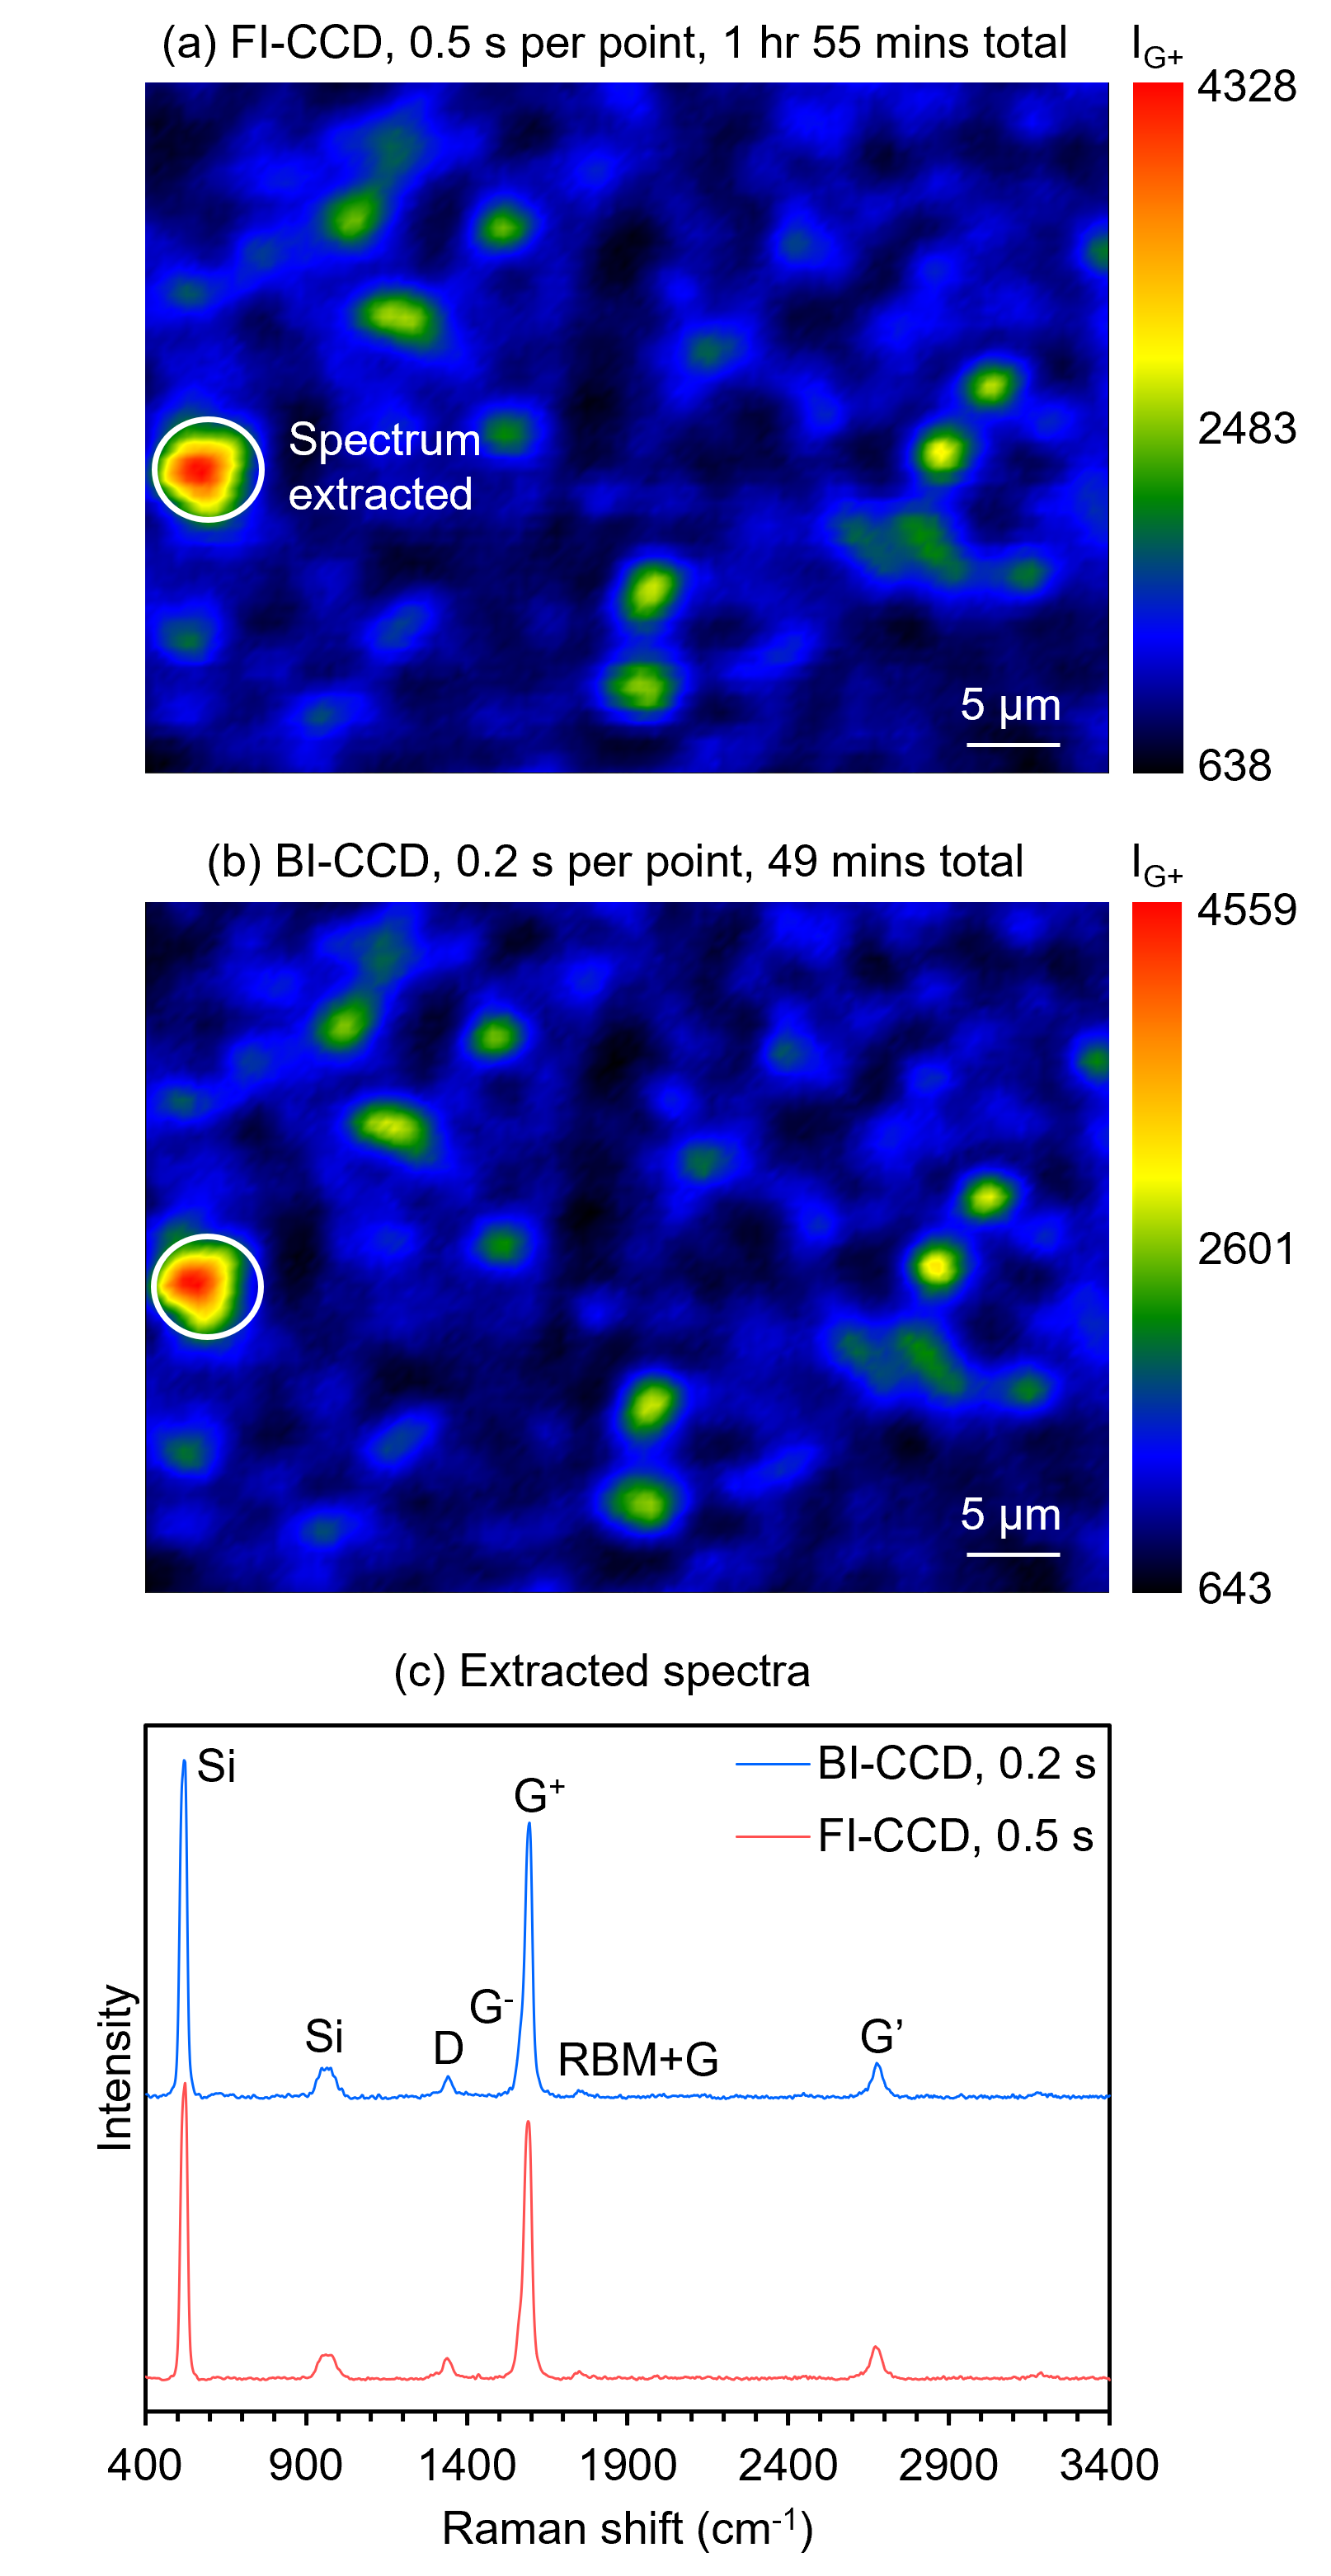
Figure 3. Raman images collected using (a) an FI-CCD and (b) a BI-CCD.


Limitations of the BI-CCD

For most Raman applications, the BI-CCD is the superior detector. However, in microscopes only containing 785 nm or 830 nm lasers for analysing low Raman scattering samples, for which long acquisition times are needed, the BI-CCD may not be the optimum choice. This is The FI-CCD may be the better option for systems with only a 785 nm or 830 nm laser for measuring low Raman scattering samples.

etaloning in Raman spectrum
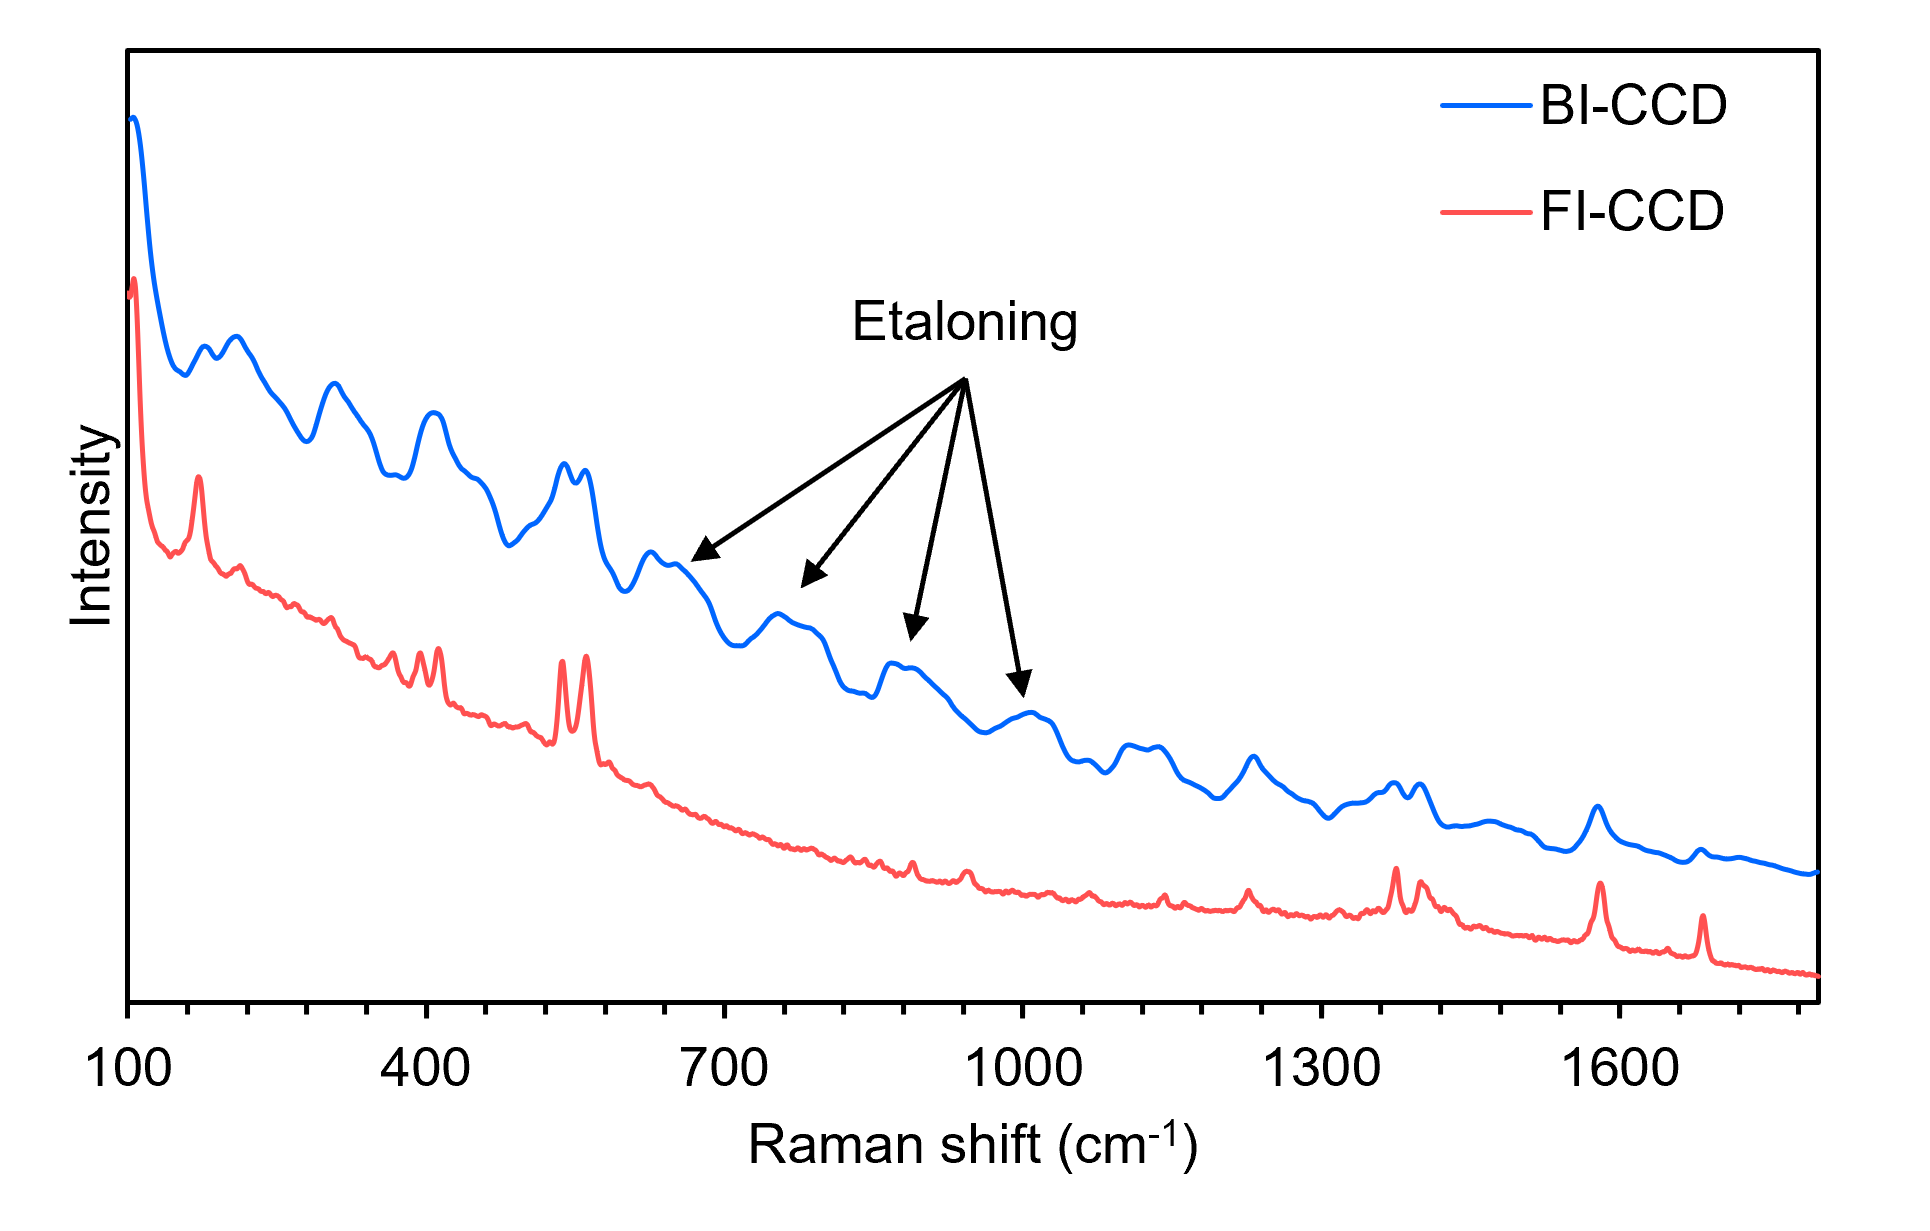
Figure 4. Raman spectra of an organic crystal recorded using a BI-CCD and a FI-CCD.

Conclusion

In this Technical Note, the spectral sensitivity of FI- and BI-CCDs were compared. The BI-CCD provides higher Raman intensities and better spectral sensitivity than the FI-CCD at 532 nm, 785 nm, and 830 nm. Raman images can be acquired twice as quickly on the BI-CCD versus the FI-CCD. Selecting the correct detector for a given application will depend on the excitation wavelength needed, the Raman scattering cross-section of the sample, and the required acquisition speed for spectral analysis or imaging.

RELATED PRODUCTS

RMS1000

Multimodal Confocal Microscope

VIEW

RM5

Raman Microscope

VIEW

Contact our expert team today to find out more about how our products can improve your research

Contact Us
PrevPrevious
NextNext
Previous Measurement of Time-Resolved Photoluminescence in the Microsecond Range Next High Pressure Spectral and Time-Resolved Photoluminescence of Halide Perovskite Crystals with a Diamond Anvil Cell

RESOURCES

Tags:
  • Technical Notes
  • RM5
  • RMS1000
  • Raman
Download PDF
Featured Product:

RM5 Raman Microscope

View more »
Suggested Reading:

No results found.

Share:

Keep up to date with the latest from Edinburgh Instruments

Join our mailing list and keep up with our latest videos, app notes and more!

LOCATION:
  • Edinburgh Instruments Ltd.
    2 Bain Square, Kirkton Campus, Livingston, EH54 7DQ.
  • sales@edinst.com
  • +44 1506 425 300
ABOUT:
  • About Us
  • Techniques
  • Applications
  • Knowledgebase
  • About Us
  • Techniques
  • Applications
  • Knowledgebase
PRODUCTS:
  • Fluorescence Spectrometers
  • Raman Microscopes
  • UV-Vis Spectrophotometers
  • Transient Absorption
  • FTIR Spectrometers
  • Lasers and LEDs
  • Customisation Options
  • Software
  • Upgrades
  • All Products
  • Fluorescence Spectrometers
  • Raman Microscopes
  • UV-Vis Spectrophotometers
  • Transient Absorption
  • FTIR Spectrometers
  • Lasers and LEDs
  • Customisation Options
  • Software
  • Upgrades
  • All Products
LEGALS:
  • News
  • Events
  • Blog
  • Careers
  • Contact Us
  • Terms and Conditions
  • Privacy Policy
  • News
  • Events
  • Blog
  • Careers
  • Contact Us
  • Terms and Conditions
  • Privacy Policy
SOCIALS:
Youtube Linkedin X-twitter Facebook
©2024 Edinburgh Instruments. Registered in England and Wales No: 962331. VAT No: GB 271 7379 37
Manage Consent
To provide the best experiences, we use technologies like cookies to store and/or access device information. Consenting to these technologies will allow us to process data such as browsing behaviour or unique IDs on this site. Not consenting or withdrawing consent, may adversely affect certain features and functions.
Functional Always active
The technical storage or access is strictly necessary for the legitimate purpose of enabling the use of a specific service explicitly requested by the subscriber or user, or for the sole purpose of carrying out the transmission of a communication over an electronic communications network.
Preferences
The technical storage or access is necessary for the legitimate purpose of storing preferences that are not requested by the subscriber or user.
Statistics
The technical storage or access that is used exclusively for statistical purposes. The technical storage or access that is used exclusively for anonymous statistical purposes. Without a subpoena, voluntary compliance on the part of your Internet Service Provider, or additional records from a third party, information stored or retrieved for this purpose alone cannot usually be used to identify you.
Marketing
The technical storage or access is required to create user profiles to send advertising, or to track the user on a website or across several websites for similar marketing purposes.
Manage options Manage services Manage {vendor_count} vendors Read more about these purposes
View preferences
{title} {title} {title}