The Stokes Shift is named after Irish physicist George Gabriel Stokes and is the spectral shift to lower energy between the incident light and the scattered or emitted light after interaction with a sample. The Stokes Shift is an important concept in both Fluorescence and Raman spectroscopy and is introduced in this article.
In the mid-19th century, G. G. Stokes extensively studied the properties of what we now know as fluorescence and investigated how the properties of the fluorescent light differed from the incident light. He presented his findings “On the Change of the Refrangibility of Light” to the Royal Society of London in 1852.1 In this work he stated that:1,2
“There is one law relating to internal dispersion [fluorescence] which appears to be universal, namely, that when the refrangibility [the extent of refraction – inversely proportional to wavelength] of light is changed by dispersion it is always lowered [shifted to longer wavelengths].”
This is Stokes’ Law and states that the fluorescence emission occurs at a longer wavelength than the incident light. The shift to longer wavelength between the absorption and fluorescence spectra is accordingly called the Stokes shift in his honour.
It worth noting that Stokes was also the first to coin the term fluorescence, which appeared as a footnote in the same paper:1,2
“I confess I do not like this term [“diffusive-reflexion”]. I am almost inclined to coin a word, and call the appearance fluorescence, from fluor-spar, as the analogous term opalescence is derived from the name of a mineral.”

Figure 1: George Gabriel Stokes (1819 to 1903).
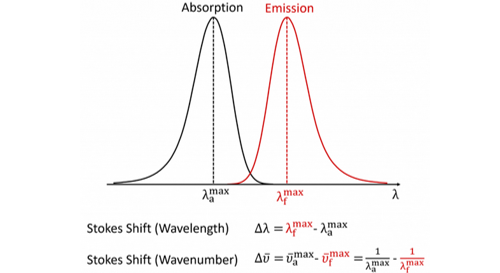
In fluorescence spectroscopy, the Stokes shift is the difference between the spectral position of the maximum of the first absorption band and the maximum of the fluorescence emission and can be expressed in either wavelength or wavenumber units as shown in Figure 2.3,4

Figure 2: Definition of the Stokes shift for fluorescence.4
It should be noted that the wavenumber Stokes shift expression written above is actually only an approximation since it assumes that the wavenumber maxima are at the same position as the wavelength maxima which is not strictly true. When fluorescence spectra are converted from a wavelength scale to a wavenumber scale the position of the maxima slightly shift since the spectral bandpass of the measurement is constant in wavelength but not in wavenumber. For very accurate wavenumber Stokes shift calculations one should therefore first convert the spectra to a wavenumber scale and locate the maxima from the wavenumber spectra (see Lakowicz Appendix I).5
The extent of the Stokes shift depends on the particular fluorophore and its solvation environment, with more polar solvents typically giving larger Stokes shifts. The emission and absorption spectra of two fluorophores with a small and large Stokes shift are shown in Figure 3.

Figure 3: The absorption and emission spectra of Rhodamine 6G in ethanol and 4-(Dicyanomethylene)-2-methyl-6-(4-dimethylaminostyryl)-4H-pyran (DCM) in 0.1 M H2SO4 measured using the FS5 Spectrofluorometer.
The origin of the Stokes shift is commonly represented in a Perrin-Jablonski diagram as an initial excitation to a higher vibrational level of the S1 followed by a rapid non-radiative decay to the vibrational ground state of the S1 (Figure 4), which means that the fluorescence will have a lower energy than the absorbed photon and therefore a longer wavelength.

Figure 4: Perrin-Jablonski showing the vibrational relaxation origin of the Stokes Shift.
While the representation in Figure 4 is accurate it poses the question of why the absorbed photon is promoted to the vibrational excited state S1, v>0 rather than the vibrational ground state, S1, v=0? After all, if the absorption transition was the S0, v=0 -> S1, v=0 and the fluorescence transition were S1, v=0 -> S0, v=0 there would be no Stokes shift as the transitions are isoenergetic. The answer to this question is that these additional transitions do occur but they are less intense.
The intensity of a transition is determined by the population difference between the initial and final states and the transition probability between those states which can be calculated using the Franck-Condon principle.
In classical terms, the Franck-Condon principle states that an electronic transition occurs without changes in the position of the nuclei of the molecule. This approximation is valid since nuclei are much more massive than electrons and therefore move relatively slowly in comparison to the rapid electronic transition, and when excited to the S1 the molecule initially has a non-equilibrium separation of the nuclei which then must relax back to their equilibrium positions.
In the quantum mechanical picture of the Franck-Condon principle, the difference in mass between the nuclei and the electrons allows the wavefunction of the molecular state to be separated into an electronic component and a nuclear (vibrational) component (Born-Oppenheimer Approximation). The transition probability between each vibrational level of the S0 and S1 is then proportional to the overlap integral between their vibrational wavefunctions.
Combining these two descriptions a hybrid classical-quantum picture of the concept can be drawn (Figure 5). The y-axis is the energy of the molecule and the x-axis is the separation between the nuclei. The black quadratic curves are the potential wells of the nuclear separation of the S0 and S1 states (under the simplifying assumption that the molecule is a diatomic harmonic oscillator) and the red curves are the wavefunctions of the quantised vibrational levels. The bottom of each well is the equilibrium separation distance between the nuclei in that state, i.e. the bond length, which is longer in S1 than S0 due to its higher energy.

Figure 5: The Franck-Condon Principle in a nuclear coordinate energy diagram.
At room temperature, the v=0 level of the S0 is the most populated (Boltzmann distribution) and the majority of absorption (blue arrow) therefore occurs from this level. The arrow is vertical since the nuclei do not move during the timescale of the absorption transition. The strongest absorption transition is to the S1 vibrational level that has greatest wavefunction overlap (highest wavefunction amplitude at the location of the blue arrow) with the v=0 level of the S0. Due to the larger separation between the nuclei in the S1 state, this is never the v=0 level but a higher vibrational level such as the v=2 as shown in Figure 5, and this transition defines the wavelength of the maximum of the absorption spectrum.
This excess vibrational energy will be rapidly lost and fluorescence will always occur from the v=0 level of the S1. Analogously to the absorption case, the strongest fluorescence transition (green arrow) will be to the vibrational level of the S0 with the greatest wavefunction overlap with the v=0 of the S1 and this transition will define the maximum of the fluorescence spectrum. The maximum of the fluorescence spectrum will therefore always occur at a longer wavelength than the absorption maximum and this is the origin of the Stokes shift.
The term Stokes shift is also used in Raman spectroscopy where it describes whether the Raman scattered radiation is at lower energy (Stokes shifted) or higher energy (anti-Stokes shifted) than the Rayleigh scattered radiation. Stokes himself never knew of Raman scattering which was first observed 25 years after his death by C. V. Raman and K. S. Krishnan in 1928.6 The use of the term Stokes shift continued from its fluorescence definition to refer to emitted (and now scattered) radiation at lower energy than the incident radiation.
The origin of the Stokes and anti-Stokes scattering is shown in Figure 6. When radiation is scattered from a molecule the majority of photons scatter elastically with no change in the vibrational energy of molecule during the scattering process (Rayleigh scattering). In Stokes Raman scattering the molecule gains a quantum of vibrational energy from the photon during the scattering process and the Stokes radiation, therefore, has a longer wavelength than the incident radiation. In anti-Stokes Raman scattering the reverse occurs, with the molecule losing a quantum of vibrational energy during the scattering process and the anti-Stokes radiation, therefore, has a shorter wavelength than the incident. Raman peaks are characterised by their wavenumber shift away from the incident radiation, with Stokes peaks having a positive wavenumber shift and anti-Stokes shifts being negative.

Figure 6: Stokes and anti-Stokes Raman scattering.
An example Raman spectrum of CCl4 is shown in Figure 7 with the Stokes and anti-Stokes shifts marked. Since anti-Stokes Raman scattering involves the loss of vibrational energy by the molecule the molecule must initially be in one of the higher-lying vibrational levels (v>0) for it to occur. At equilibrium the majority of the molecules are in the v=0 level and the anti-Stokes lines are therefore significantly weaker than the Stokes, as can be seen in Figure 7, and for this reason, only the more intense Stokes lines are typically measured in a standard Raman experiment.
 Figure 7: Raman spectrum of CCl4 excited with a 532 nm laser.
2. McCartney, A. Whitaker, and A. Wood, George Gabriel Stokes: Life, Science and Faith (2019)
5. Lakowicz, Principles of Fluorescence Spectroscopy,3rd ed. Springer (2006)
6. V. Raman, A new radiation, Indian J. Phys. 2 387–398 (1928)
For more information on the theory and practice of Raman and fluorescence spectroscopy visit our blog. Alternatively, if you are looking to measure the Stokes shift of your own samples check out our range of fluorescence spectrometers and Raman microscopes.