Raman spectroscopy is an analytical technique where scattered light is used to measure the vibrational energy modes of a sample. It is named after the Indian physicist C. V. Raman who, together with his research partner K. S. Krishnan, was the first to observe Raman scattering in 1928.1 Raman spectroscopy can provide both chemical and structural information, as well as the identification of substances through their characteristic Raman ‘fingerprint’. Raman spectroscopy extracts this information through the detection of Raman scattering from the sample.
When light is scattered by a molecule, the oscillating electromagnetic field of a photon induces a polarisation of the molecular electron cloud which leaves the molecule in a higher energy state with the energy of the photon transferred to the molecule. This can be considered as the formation of a very short-lived complex between the photon and molecule which is called the virtual state of the molecule. The virtual state is not stable and the photon is re-emitted almost immediately, as scattered light.

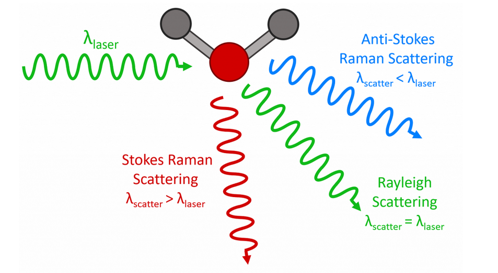
Figure 1: Three types of scattering processes that can occur when light interacts with a molecule.
In the vast majority of scattering events, the energy of the molecule is unchanged after its interaction with the photon; and the energy, and therefore the wavelength, of the scattered photon is equal to that of the incident photon. This is called elastic (energy of scattering particle is conserved) or Rayleigh scattering and is the dominant process.
In a much rarer event (approximately 1 in 10 million photons)2 Raman scattering occurs. This is an inelastic scattering process with a transfer of energy between the molecule and scattered photon. If the molecule gains energy from the photon during the scattering (excited to a higher vibrational level) then the scattered photon loses energy and its wavelength increases. This is called Stokes Raman scattering (after G. G. Stokes). Inversely, if the molecule loses energy by relaxing to a lower vibrational level, the scattered photon gains the corresponding energy and its wavelength decreases. This is called Anti-Stokes Raman scattering.
Quantum mechanically, Stokes and Anti-Stokes are equally likely processes. However, with an ensemble of molecules, the majority of molecules will be in the ground vibrational level (Boltzmann distribution) and Stokes scatter is the statistically more probable process. As a result, the Stokes Raman scatter is always more intense than the anti-Stokes. For this reason, it is nearly always the Stokes Raman scatter that is measured in Raman spectroscopy.

Figure 2: Jablonski Diagram showing the origin of Rayleigh, Stokes and Anti-Stokes Raman Scatter.
It is clear from the above, that the wavelength of the Raman scattered light will depend on the wavelength of the excitation light. This makes the Raman scatter wavelength an impractical number for comparison between spectra measured using different lasers. The Raman scatter position is therefore converted to a Raman shift away from excitation wavelength:

The first term is the wavenumber Raman shift in cm-1, λ(0) is the wavelength of the excitation laser in nm, and λ(1) is the wavelength of the Raman scatter in nm.
Figure 2 shows that Raman spectroscopy measures the energy gap between the vibrational levels of the molecule. The ladder of vibrational levels shown in Figure 2 is for a single vibrational mode of the molecule. Polyatomic molecules will contain many vibrational modes, each with their own ladder of vibrational levels.
For non-linear molecules with N atoms, the number of vibrational modes is given by:
3N – 6
3N is the total degrees of freedom of the molecule and the translational 3 degrees of freedom, and 3 rotational are then subtracted which leaves 3N – 6 vibrational modes. For linear molecules, there is one less rotational degree of freedom and the number of vibrational modes is therefore:
3N – 5
Not all vibrational modes can be detected using Raman spectroscopy. For a vibrational mode to be measured it must be ‘Raman Active’ which occurs when the molecular polarisability changes during the vibration.
An example Raman spectra of carbon tetrachloride (CCl4) and is shown in Figure 3. CCl4 is a tetrahedral molecule with three pronounced Raman active vibrational modes in the 100 cm-1 to 500 cm-1 wavenumber region (there is an additional peak at ~780 cm-1 which is not shown). In the centre of the spectrum is the Rayleigh scatter peak at the laser wavelength. This peak is millions of times more intense than the Raman scatter and is therefore normally blocked by a notch or edge filter in the Raman spectrometer, but was included here for clarity.
Symmetrically placed on either side of the Rayleigh peak are the three Stokes and three Anti-Stokes peaks corresponding to the three most intense Raman active vibrations of CCl4. It can be seen that the Anti-Stokes lines are much weaker than the Stokes due to the larger population of molecules in the ground vibrational level of each mode. CCl4 has one of the simplest Raman spectra but the same principle applies for all samples: Raman spectroscopy is used to measure the unique vibrational fingerprint of the sample and from that information chemical, structural and physical properties can be determined.

Figure 3: Raman Spectrum of CCl4 measured using a 532 nm laser.

Edinburgh Instruments’ RM5 Raman Microscope is designed for analytic and research purposes. The truly confocal design is unique to the market and offers uncompromised spectral resolution, spatial resolution, and sensitivity.
The RM5 builds on the expertise of robust and proven building blocks, combined with modern optical design considerations; and a focus on function, precision and speed. Easily learn more about our range of high performance instrumentation and discover the best Raman solutions for all research and analytical requirements.
1. C.V. Raman & K. S. Krishnan, A New Type of Secondary Radiation, Nature 121, 501- 502 (1928)
2. E. Smith & G. Dent, Modern Raman Spectroscopy: A Practical Approach 1st ed. , Wiley (2005)