The Stern-Volmer plot is used to study the interaction dynamics between a fluorescent emitter and a quencher (a substance that reduces the fluorescence intensity). The plot shows the ratio of the fluorescence intensity as a function of the quencher’s concentration [Q], described by Eq. 1:
Where I0 and I are the fluorescence intensity in the absence and presence of a quencher respectively and KSV is the Stern-Volmer constant. For systems showing only dynamic quenching, KSV can be determined from the slope of the Stern-Volmer plot, as shown in Figure 1.
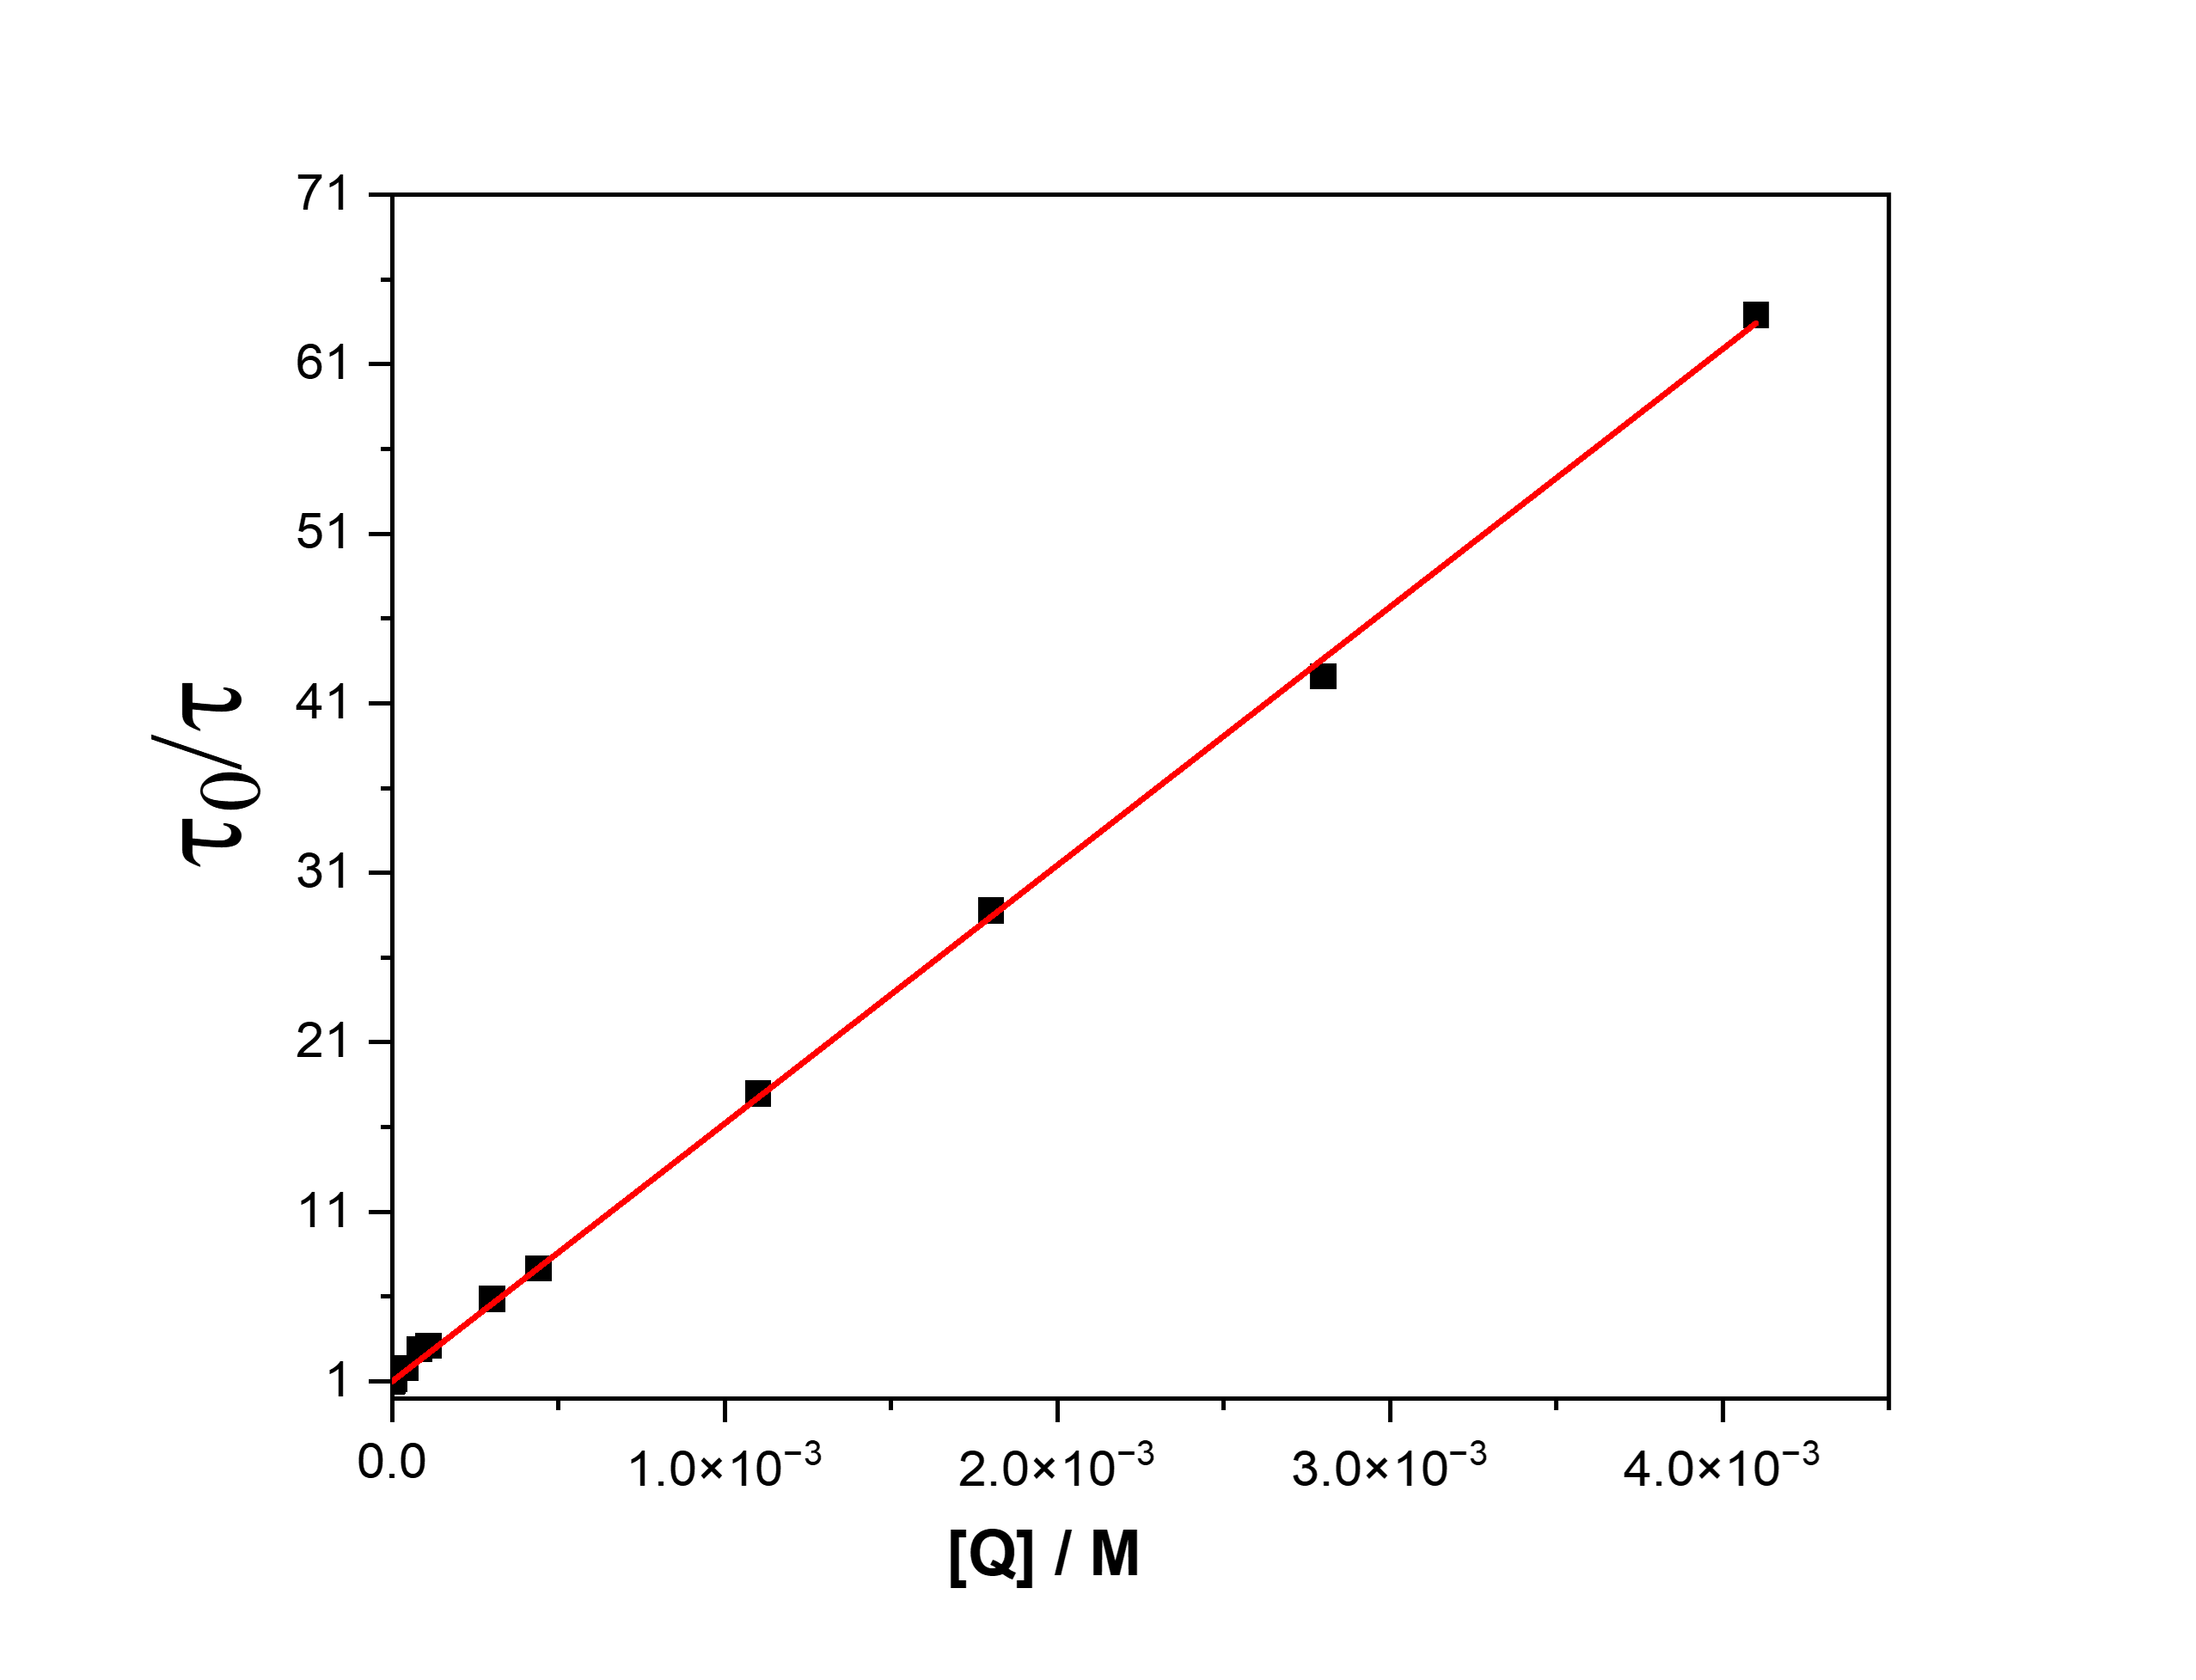
Figure 1. Example of an intensity Stern-Volmer plot of the system fac-Ir(ppy)3 and the quencher 2,4dinitrotoluene. The slope provides the Stern-Volmer constant.
The Stern-Volmer constant provides information about the sensitivity of the quenching system and, for dynamic quenching, is given by Eq. 2: ![]() Where τ0 is the fluorescence lifetime of the emitter in the absence of a quencher, and kq is the bimolecular quenching constant. The constant kq describes how efficiently the quencher suppresses the emission intensity of the system, and its value is typically in the range of 109 – 1010 M−1 s−1.1,2
Where τ0 is the fluorescence lifetime of the emitter in the absence of a quencher, and kq is the bimolecular quenching constant. The constant kq describes how efficiently the quencher suppresses the emission intensity of the system, and its value is typically in the range of 109 – 1010 M−1 s−1.1,2
Since the relative change in intensity I0/I is proportional to a corresponding change in fluorescence lifetime, Eq. 1 can also be written as a function of lifetime (Eq. 3). This allows a dynamic quenching interaction to also be characterised from changes in the fluorescence lifetime. The Stern-Volmer constant KSV and bimolecular quenching constant, kq, can be determined as a function of changes in lifetime with quencher concentration (Figure 2). 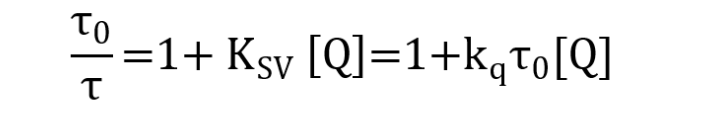

Figure 2. Example of a lifetime Stern-Volmer plot of the system fac-Ir(ppy)3 and the quencher 2,4dinitrotoluene. The slope provides the Stern-Volmer constant.
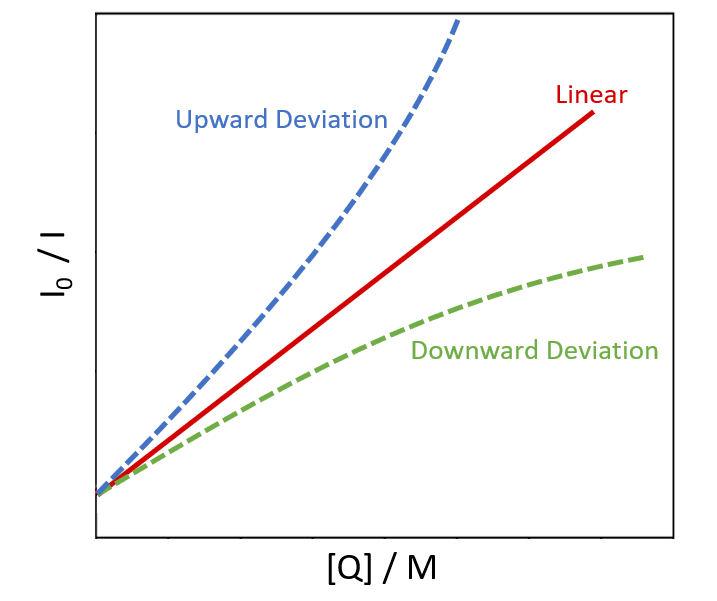
A linear relationship in the Stern-Volmer (SV) plot is the most common behaviour of fluorescence quenching. However, upward, or downward deviation behaviour is also possible (Figure 3).

Figure 3. Stern-Volmer plot for quenching systems showing linear relationship (red curve); upward deviation relationship (blue curve); and downward deviation (green curve).
A linear relationship is most associated with dynamic quenching, where the quenching is mainly due to collisions between the emitter and quencher molecules. However, the linear relationship on the Stern-Volmer plot can also be associated with a purely static quenching system. Since static quenching does not show changes in the emission lifetime as a function of the quencher concentration lifetime measurements can be used to distinguish between the two.1
The upward/positive deviation is found in systems in which both static and dynamic quenching are contributing to the decrease in fluorescence intensity. A downward/negative deviation is generally associated with the presence of two emitters with different Stern-Volmer constants, e.g., for the same concentration of quencher, the emitters will be quenched at different rates. In most cases, at lower concentrations of quencher, a linear relationship is evident; however, as the quencher concentration increases, the relationship becomes non-linear.