The spectral resolution in Raman spectroscopy dictates the maximum number of spectral peaks that the spectrometer can resolve. The level of spectral resolution required is dependent on the sample and what information the user is aiming to obtain from the Raman spectrum. Five main factors determine the spectral resolution achievable: slit size, diffraction grating, spectrometer focal length, detector, and the excitation laser.
The slit is essential to spectrometer performance and determines optical resolution and throughput. The smaller the slit size the higher spectral resolution achievable, the larger the slit width the higher the throughput. Different excitation wavelengths are also better suited to different slit sizes, for example a 532 nm laser will give much more Raman signal than a 785 nm laser and so a smaller slit size can be used without concern for the signal intensity being too low with the visible laser compared to analysing the same sample with a 785 nm excitation.
Figure 1 shows Raman spectra of tryptophan acquired using two different slit sizes. Clearly, the 100 μm slit provides higher Raman intensity due to the higher laser throughput with a larger slit size. However, reducing the slit size to 20 μm reveals more details in the Raman spectra therefore increasing the spectral resolution. Peaks become better defined, for example the shoulders at approximately 1350 cm-1 and 1580 cm-1 are much more defined as individual peaks when using the smaller slit size. Furthermore, the background fluorescence has been reduced upon closing the slit down.
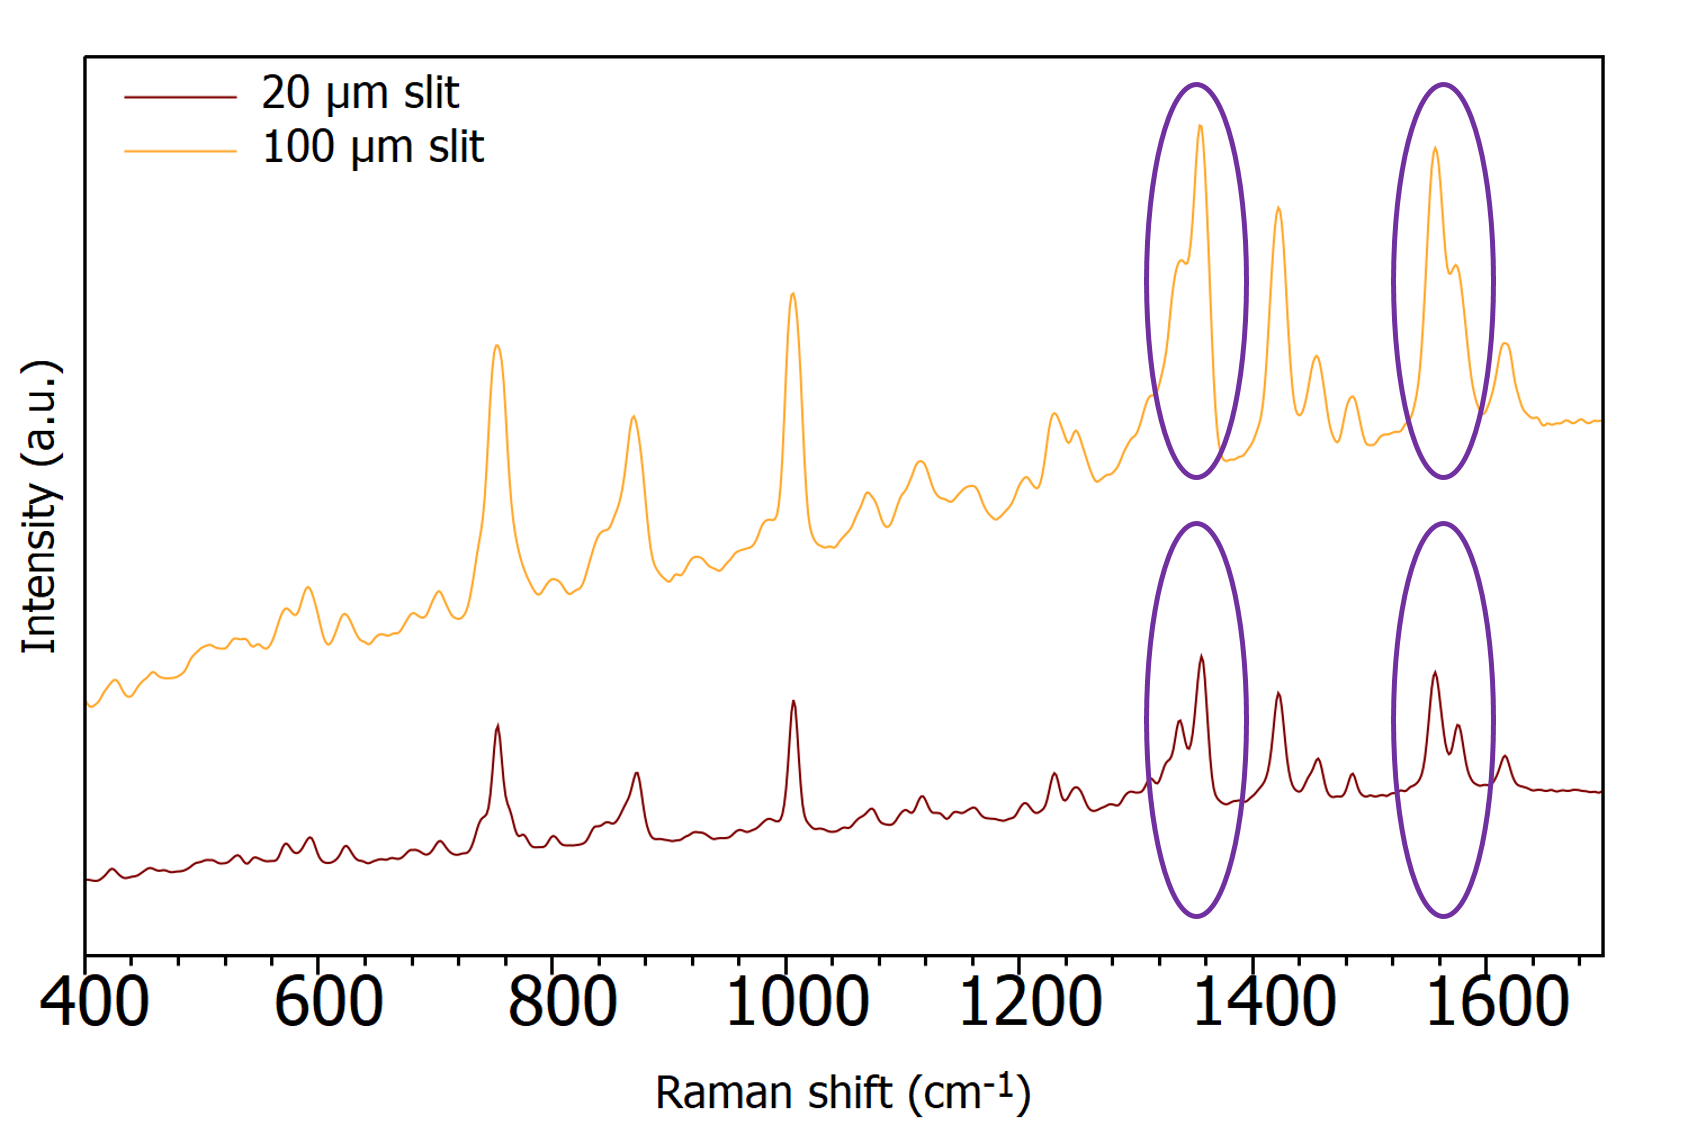
Figure 1: Raman spectra taken on the RM5 Raman Microscope of tryptophan using a 532 nm laser and two different slit sizes; 20 μm (dark red) 100 μm (orange).
A spectrometers grating disperses the signal onto the detector. Each diffraction grating has a groove density, measured in number of grooves per millimetre (g/mm). The higher the groove density, the better the spectral resolution. Typical gratings start at 300 g/mm through to 1800 g/mm and highly specialised gratings available with 2400 g/mm and 3600 g/mm. However, gratings have limitations. Firstly, there is a working range a grating can successfully operate in, this is because dispersion is wavelength dependent. The theoretical wavelength limit for a grating with groove density n is λ=2/n. For example, a 2400 g/mm grating will be limited to the green end of the spectrum and a 3600 g/mm not diffracting much after 500 nm, making it suited to UV excitation.
Secondly, when using a lower g/mm grating more spectral range will be acquired, whilst a high g/mm allows for high spectral resolution. To overcome this problem most Raman spectrometers have a grating turret hosting several gratings for optimisation over the full spectral range. Often it is useful to use a grating showing a broad spectral range and then narrowing into a more specific wavenumber range with a high-resolution grating for increased spectral resolution in a region of interest.
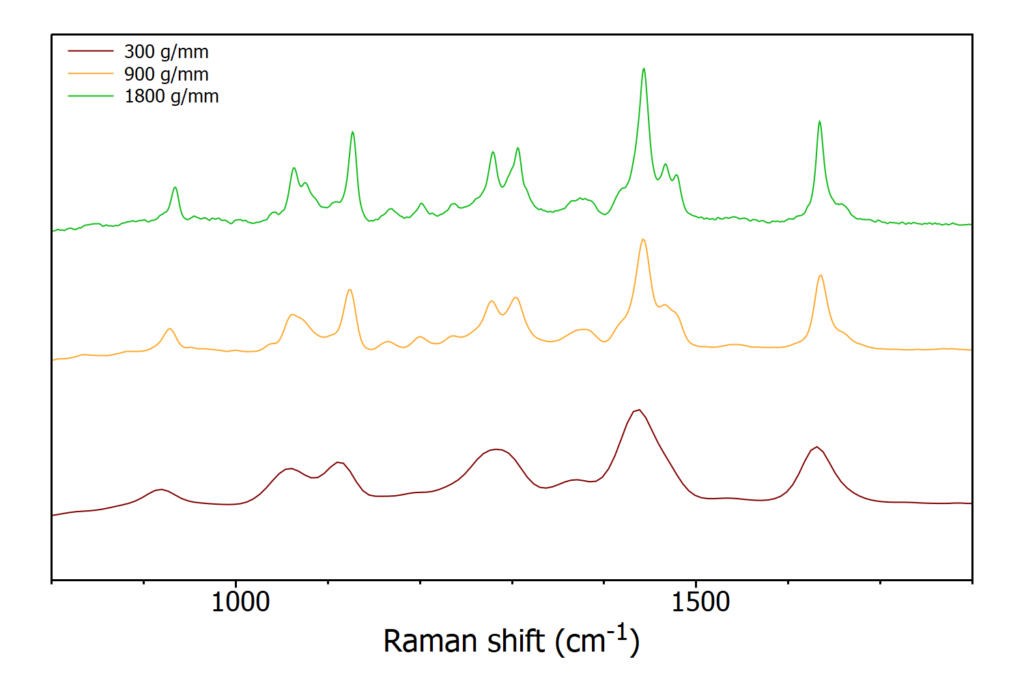
Figure 2 highlights the advantage of changing to a higher groove density grating. It is obvious to see the improvements in spectral resolution between using a 300 g/mm grating and an 1800 g/mm grating. As discussed, the sacrifice of increased spectral resolution is the spectral range, for the data presented below the full spectral range was covered for the 300 g/mm, whilst the 1800 g/mm only covered the range of 600 cm-1 to 2300 cm-1.

Figure 2: Raman spectra taken on the RM5 Raman Microscope of nylon-6 with a 532 nm laser and three different diffraction gratings.
The distance between the focusing mirror and the detector is termed the spectrometer focal length. The longer the spectrometer focal length the better the spectral resolution. Typical benchtop Raman systems use a 200 – 250 mm focal length which provides standard resolution whilst keeping the instrument compact. For samples which require ultimate spectral resolution and Raman applications in the UV spectral range a longer spectrograph of >500 mm focal length is commonly used. A longer focal length provides increased spectral resolution due to wider separation of light, however will also increase the size of the Raman system, and reduce the Raman intensity. Figure 3 highlights the difference in the resolving of peaks using different focal lengths. A longer spectrograph uses large mirrors and gratings to provide better resolution, stray light performance, and maximum optical throughout for sensitive measurements. A long focal length spectrometer (i.e. high resolution) can also be adapted with suitable grating selection to be run-in low-resolution mode.

Figure 3: Dispersion of light using a short focal length (top), and a long focal length (bottom).
In most dispersive Raman spectrometers array detectors are used, commonly silicon charged couple devices (CCDs) or, in the NIR region, InGaAs array detectors. These detectors are an array of pixels, with each pixel representing a portion of the spectrum. The effect of detector selection on spectral resolution is not a commonly used tool for improving resolution as most systems only use one detector. Detector choice is concerned more with excitation laser source and detector speed and the detector is not chosen for its enhancement of spectral resolution. Simply, detectors used in Raman spectroscopy have varying pixel size, and the smaller the pixel size the higher the spectral resolution.
Laser wavelength also affects spectral resolution. The spectral resolution decreases as the excitation wavelength decreases since Raman spectra uses an energy related unit (wavenumber, cm-1). For example, to achieve the same spectral resolution as an infra-red laser using a 600 g/mm grating with a visible laser a 1200 g/mm or 1800 g/mm grating would be required. However, there are many additional contributions to laser choice in Raman spectroscopy, if you want to find out more on this read our blog post on how to choose your lasers for Raman spectroscopy.
It is important to note that whilst spectral resolution is vital, the linewidth of the signal is also a consideration for whether the Raman system requires a high resolution set up or not. As long as the resolution is greater than the linewidth the user will get all the information from the Raman spectrometer regardless of whether a high- or low-resolution system is used. For most samples medium spectral resolution is sufficient for high quality Raman data. The characterisation of polymorphs and crystallinity are two examples of when the user may need the highest possible resolution. Using a higher resolution will increase the total measurement time, and sometimes gaining a higher resolution using a smaller slit size results in too much loss in Raman intensity.
As with most Raman measurement there will be a compromise between resolution, acquisition time and Raman intensity. The high flexibility of Edinburgh Instruments Raman microscopes allows the user the freedom to explore all these options to achieve the highest quality Raman spectra possible.
If you are working in the field of Raman Spectroscopy, our Raman Confocal Microscope may be the perfect partner for your Raman research. For further information please Contact Us.