Welcome to Edinburgh Instruments’ monthly blog celebrating our work in Raman, Photoluminescence, and Fluorescence Lifetime Imaging. Every month we will highlight our pick for Map of the Month to show how our spectrometers can be used to reveal all the hidden secrets in your samples.
“I am an on-off sufferer of hay fever year after year, but this year has been particularly bad! Runny itchy eyes and lack of sleep led me to go and get some prescription medicines, and I have also been seen wearing sunglasses in overcast weather as it’s still bad.”
– CJ Seller, Head of Marketing
With summer in full swing in Scotland, we’ve started to notice some cases of runny noses and sneezing in the office at Edinburgh Instruments. This is because, unfortunately for some, with the summer comes the unwelcome arrival of seasonal allergies. Hay fever is a common, relatively harmless but nonetheless frustrating allergic condition that, according to the NHS, affects up to 1 in 5 people at some point in their life. Our Technical Marketing team actually suffers from the allergy at a much higher rate, with 50% of us having experienced symptoms at some point in the past. It is caused by the release of pollen by trees, grass, and flowers into the air as part of their reproductive cycle. When someone suffers from hay fever, exposure to pollen particles results in the misidentification of a threat in their body and this induces an immune response. It is this immune response that leads to unwanted inflammatory symptoms such as sneezing, a blocked nose, and irritation of the eyes, mouth, and throat.
“I suffer from bad hay fever every year. Both tree and grass pollen, which means I can’t even have fresh flowers at home. I’m mostly affected by my throat and sinuses, which often leads to recurring sinus infections. Over-the-counter medication would ease symptoms until this year when I had to go to the GP to get prescription strength as pollen has been so high.”
– Niamh Kenny, Marketing Assistant at Techcomp.
Raman microscopy can be used to analyse and image the chemical fingerprints of these microscopic culprits that cause summers of sneezing. Despite irritating many people, pollen is also crucial for biodiversity and crop cultivation, so the analysis of different species is of significant interest to researchers.

Figure 1: Edinburgh Instruments Applications Scientist Matthew using an RMS1000 Raman Microscope.
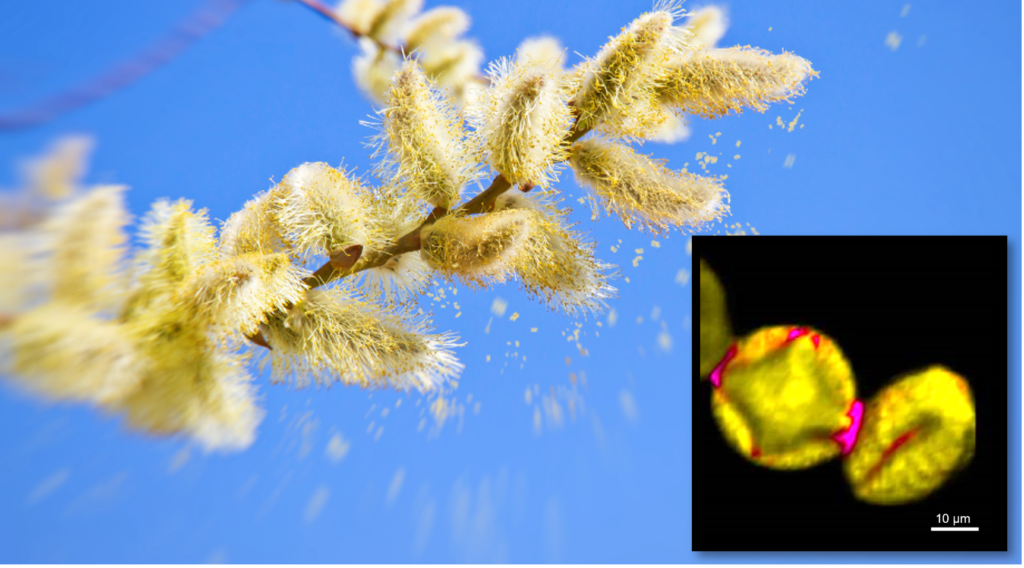
In Figure 2, a map of two pollen grains can be seen, as well as a corresponding Raman spectrum, both of which were acquired with an RMS1000 Raman Microscope. The map shows the distribution of proteins (yellow) and pigments (pink) on the pollen grains, and the spectrum also shows contributions from carbohydrate, polymer, and lipid molecules present in the grains.

Figure 2: Imaging and spectral analysis of pollen using an RMS1000 Raman Microscope.
To find out more about how Raman microscopy can be used for the analysis of pollen, why not take a look at our blog post for World Bee Day?
If you have enjoyed this blog, don’t forget to subscribe to our eNewsletter and follow us on social media using the links below!