Welcome to Edinburgh Instruments’ monthly blog celebrating our work in Raman, Photoluminescence, and Fluorescence Lifetime Imaging. Every month we will highlight our pick for Map of the Month to show how our spectrometers can be used to reveal all the hidden secrets in your samples.
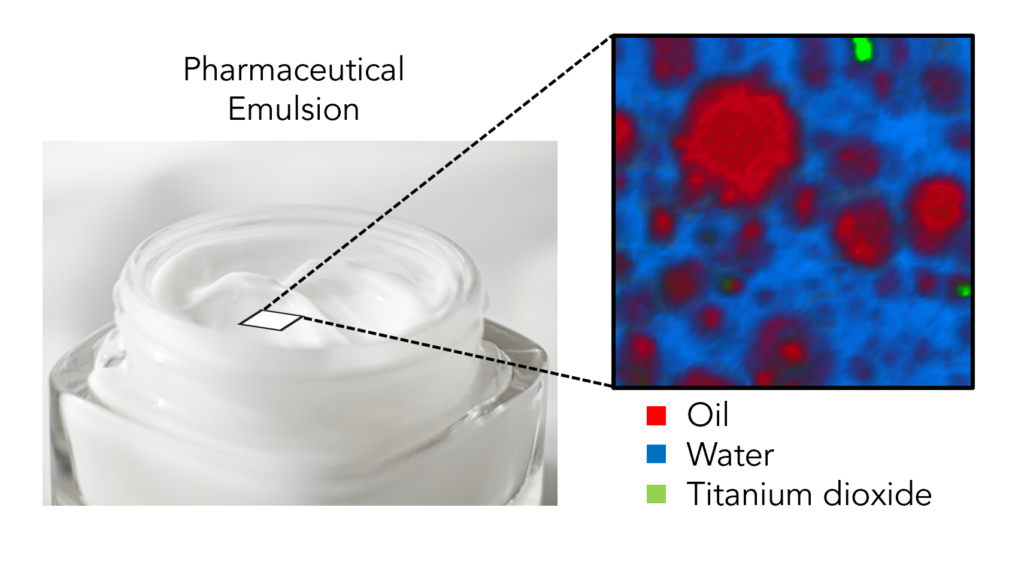
An emulsion can be defined as a mixture in which a liquid, such as oil, is dispersed in small globules through another liquid in which it is immiscible, such as water. The pharmaceutical industry frequently uses emulsions in skincare products, cosmetics, vaccines, and medications. In medicine, emulsions can be used to increase the bioavailability of drug compounds that are insoluble in water, and they can cover the unpleasant taste of drugs that must be administered orally. Over-the-counter products such as moisturising creams are manufactured in this way too because they are easily washed off with water and do not feel greasy on the skin. To ensure that such products are of high quality and meet their specific application needs, the characterisation of the morphology and distribution of particles within emulsions is crucial. Raman microscopy is an excellent technique for characterising such samples; it can produce highly detailed images with extremely specific chemical fingerprints at each image pixel, and thus can identify and spatially resolve multiple components within a mixture simultaneously.
In this Map of the Month blog post, we performed the 3D chemical imaging of an oil-in-water (o/w) moisturising hand cream using an RMS1000 Confocal Raman Microscope. The sample was squeezed directly from the bottle onto a microscope slide and a glass coverslip was placed on top to prevent it from drying out. Imaging was then performed with a 532 nm laser and step sizes of 0.5 μm in X and Y and 1 μm in Z. A 100X objective and a confocal pinhole diameter of 50 μm were used to ensure high spatial resolution and effective layer discrimination in Z. The resulting image is shown in Figure

Figure 1. 3D Raman imaging of an o/w moisturising hand cream emulsion. Each frame in the time series represents a different Z plane.
It is clear from the Raman image of the emulsion and the corresponding spectra, Figure 2, that there are 3D oil particles (red) of various sizes dispersed within a continuous aqueous phase (blue). In areas where there are oil particles, there is a series of high-intensity bands between 2800 cm-1 and 3000 cm-1 that can be assigned to CH2, CH, and CH3 vibrations. These bands are diminished in the aqueous phase relative to a band that peaks between 3400 cm-1 and 3500 cm-1, which is characteristic of OH vibrations and thus can be assigned to water. Also observed in the mixture were particles of titanium dioxide (green) at different depths, which displayed a very intense and narrow peak at 148 cm-1 and gives the sample its white colour.

Figure 2. Raman spectra from the sample’s water, titanium dioxide, and oil components. The arrows indicate the bands that were used to build the image in Figure 1.