Skip to content
Skip to content
  • News
  • Events
  • eBooks
  • Blog
  • Careers
  • Contact
  • News
  • Events
  • eBooks
  • Blog
  • Careers
  • Contact
KNOWLEDGEBASE
  • About Us
  • Products

    Fluorescence Spectrometers

    • FLS1000 Photoluminescence Spectrometer
    • FS5 Spectrofluorometer
    • LifeSpec II Lifetime Spectrometer
    • Mini-tau Lifetime Spectrometer

    Raman Microscopes

    • RM5 Raman Microscope
    • RMS1000 Multimodal Confocal Microscope

    Transient Absorption

    • LP980 Transient Absorption Spectrometer

    FTIR Spectrometers

    • IR5 FTIR Spectrometer

    Lasers and LEDs

    • Pulsed Lasers
    • Gas Lasers
    • Customisation Options
    View All Products
  • Techniques
  • Applications
KNOWLEDGEBASE
Edit Content
  • About Us
  • Products
  • Techniques
  • Applications
  • Knowledgebase
  • eBooks
  • News
  • Events
  • Blog
  • Careers
  • Contact Us

RESOURCES

Raman Spectroscopy for the Characterisation of Dipyridamole-Infused 3D-Printed Bone Implants

  • June 26, 2025

KEY POINTS

  • Combining 3D-printed polymers with drugs like dipyridamole (DIP) enables the creation of personalised, low-cost bone implants that provide controlled drug release to enhance bone regeneration.
  • DIP produces a distinctive Raman spectrum that enables it to be clearly distinguished from the 3D-printed polymer matrices making up bone implants.
  • Raman mapping provides critical insight into the spatial distribution of DIP within 3D-printed scaffolds.
Edit Content

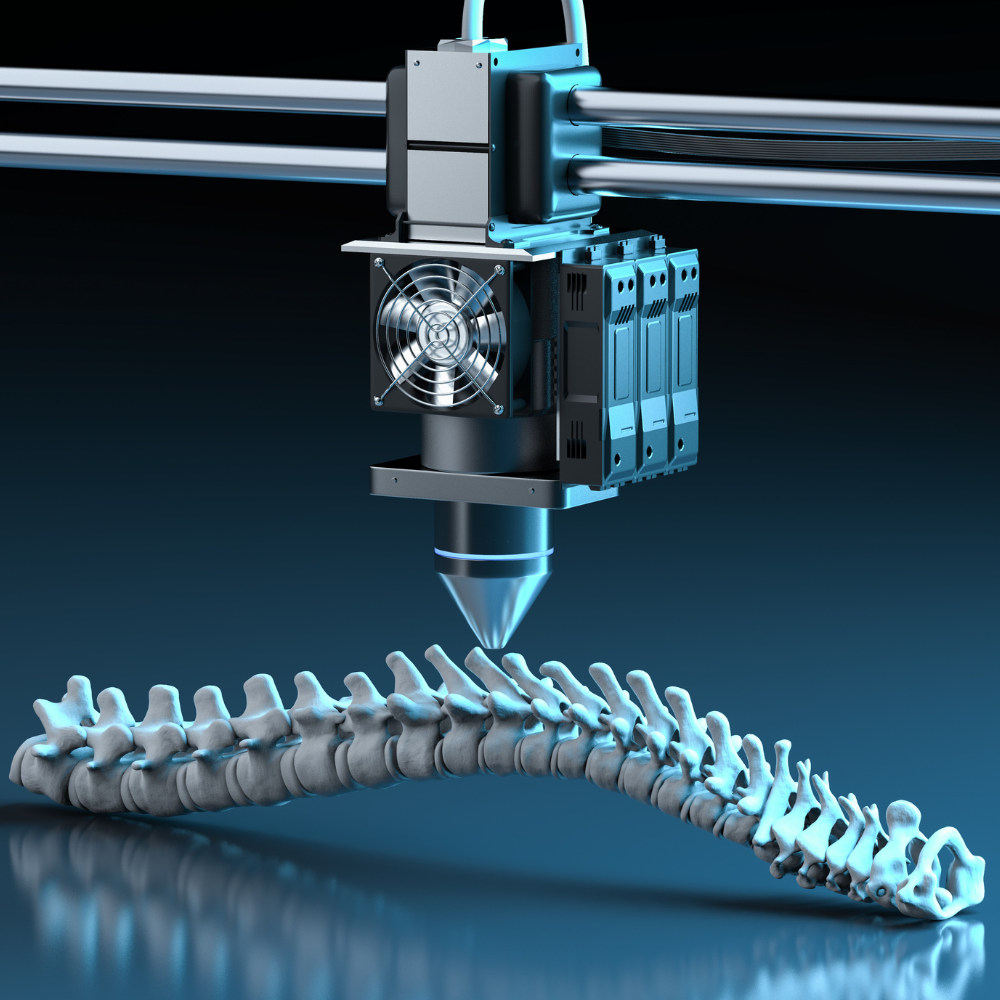
Additive manufacturing or 3D printing has emerged as a revolutionary approach in various therapeutic applications. In particular for bone tissue engineering, 3D printing offers unprecedented control over the fabrication of scaffolds that can mimic the complex architecture of natural bone and the creation of personalised implants.  

Synthetic polymers, such as thermoplastic polyurethane (TPU), have demonstrated great potential in 3D-printed bone tissue engineering. A key advantage of 3D printing bone scaffolds is the ability to embed therapeutic agents into the base material.1 Dipyridamole (DIP), an antiplatelet drug known to enhance bone regeneration, shows significant potential when integrated into 3D-printed bone implants, offering improved bone regeneration with minimal side effects. 

Accurate characterisation of drug-infused implants is crucial to confirm uniform drug distribution and ensure effective release when integrated into bone. Raman microscopy is a powerful, non-destructive technique for discriminating drugs in polymer matrices and imaging their distribution (Figure 1).  

This Research Highlight presents collaborative work from Queens University Belfast, University of Girona, Ulster University, Universidad de Santander, and Universidad de Sevilla. The study demonstrates successful doping of polymer implants with two concentrations of DIP and detailed characterisation using an RM5 Confocal Raman Microscope. Published in the Journal of Drug Delivery and Translational Research, this work highlights the potential role of advanced spectroscopic techniques in developing next-generation drug-infused 3D-printed bone implants.2  

Schematic diagram illustrating the methodology for 3D-printed drug-infused bone and Raman characterisation, adapted from Wang et al

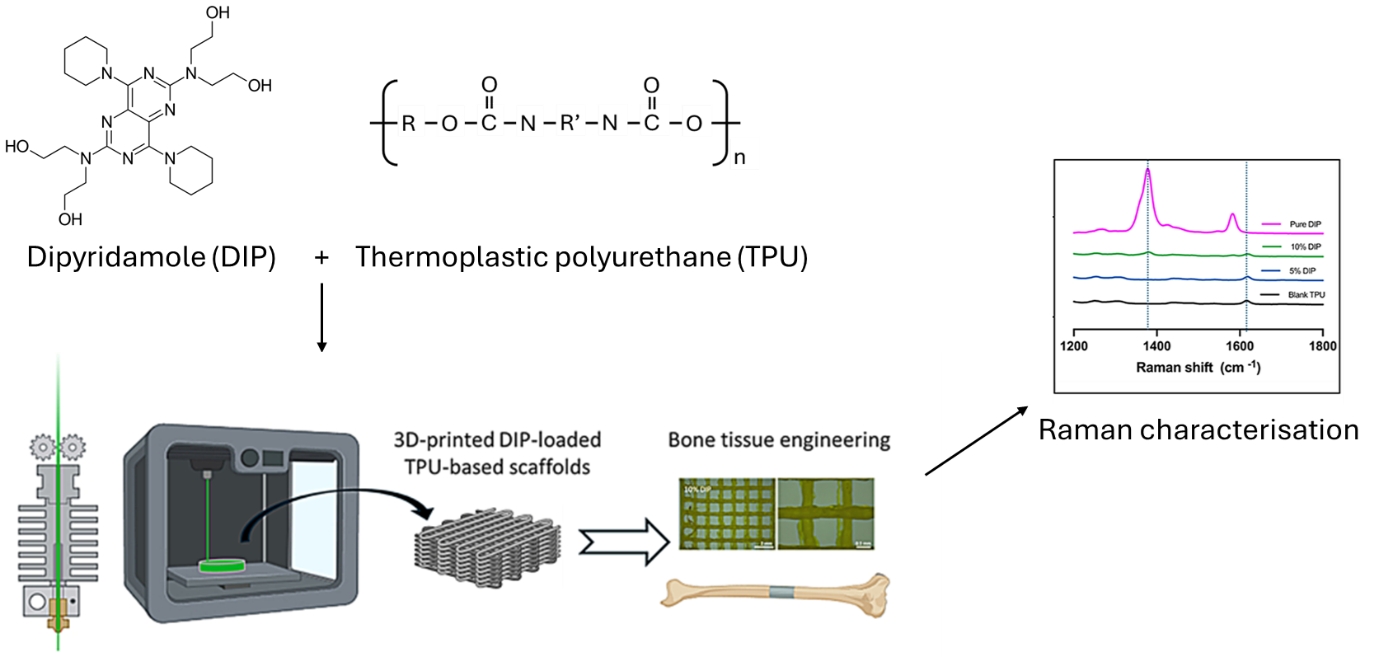
Figure 1. Schematic diagram illustrating the methodology for 3D-printed drug-infused bone and Raman characterisation, adapted from Wang et al.2   


Materials & Methods 

Samples of TPU and TPU/DIP (5% and 10%) were prepared following the research group’s previous methodology.1 The final composite material was then designed using computer-aided design (CAD) and an Ultimaker 3 3D printer to produce discs, meshes and rectangular blocks.  

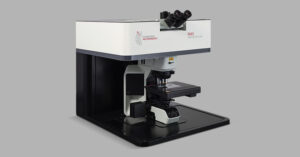
Measurements were collected with an RM5 (Figure 2) equipped with a 785 nm laser and 10x 0.25 NA objective lens. Spectra were acquired using a 300 µm pinhole, 70 µm slit and 100% laser power, with a 2.5 second exposure time and three accumulations. Background subtraction was performed using Ramacle® software. Raman images were collected using a 15 x 15 point grid. Contrast was obtained by mapping the peak intensity between 1350-1400 cm-1, attributable to DIP, from each pixel. 

RM5 Raman Microscope

Figure 2. RM5 Confocal Raman Microscope.  


Dipyridamole and Thermoplastic Polyurethane Raman Detection

To ascertain the feasibility of tracking the drug in the polymer scaffold, Raman characterisation was performed on TPU, TPU with 5% DIP, TPU with 10% DIP, and pure DIP (Figure 3). This technique is particularly well-suited for discriminating between the drug and the polymer matrix due to its high spectral resolution, allowing specific chemical bonds to be identified.  

In the pure TPU spectra (black), a characteristic peak was observed at 1615 cm−1, attributed to the C=O stretching from the polymer. The pure DIP sample (pink), conversely, displayed an intense peak between 1350−1400 cm−1, which corresponded to C-N stretching. 

Both drug-infused samples (TPU/5% DIP and TPU/10% DIP) exhibited the C=O TPU Raman signature. Crucially, the appearance of the C-N peak confirmed the presence of DIP within these samples, as this signature was absent in the pure TPU. Since Raman intensity is proportional to concentration, the intensity of the 1350−1400 cm−1 peak increased with higher DIP loading.  

Raman spectra of pure DIP, pure TPU and 3D-printed samples containing TPU/5% DIP & TPU/10% DIP, respectively

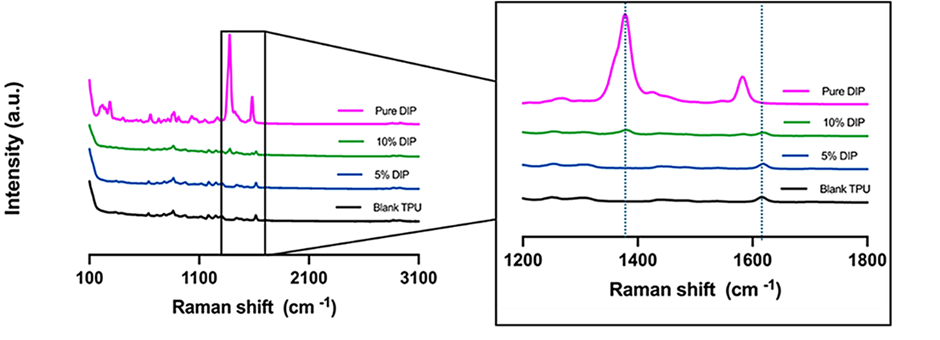
Figure 3. Raman spectra of pure DIP (pink), pure TPU (black) and 3D-printed samples containing TPU/5% DIP (blue) & TPU/10% DIP (green), respectively. 


Spatial Distribution of Dipyridamole 

To understand the spatial distribution of DIP, the TPU/10% DIP sample was chosen for Raman mapping. The ability to track individual vibrational modes, and the high spatial resolution offered by coupling Raman with a confocal microscope, means that the distribution of DIP within TPU could be imaged. 

The distinct C-N stretching at 1350−1400 cm-1, unique to DIP was used to generate the Raman map. The inherent linearity and concentration-dependence of Raman spectroscopy mean that as DIP loading increases, the intensity of this peak is expected to rise proportionally, enabling effective visualisation and even potential quantification. Figure 4 provides clear evidence of the even distribution of DIP across the sample surface.

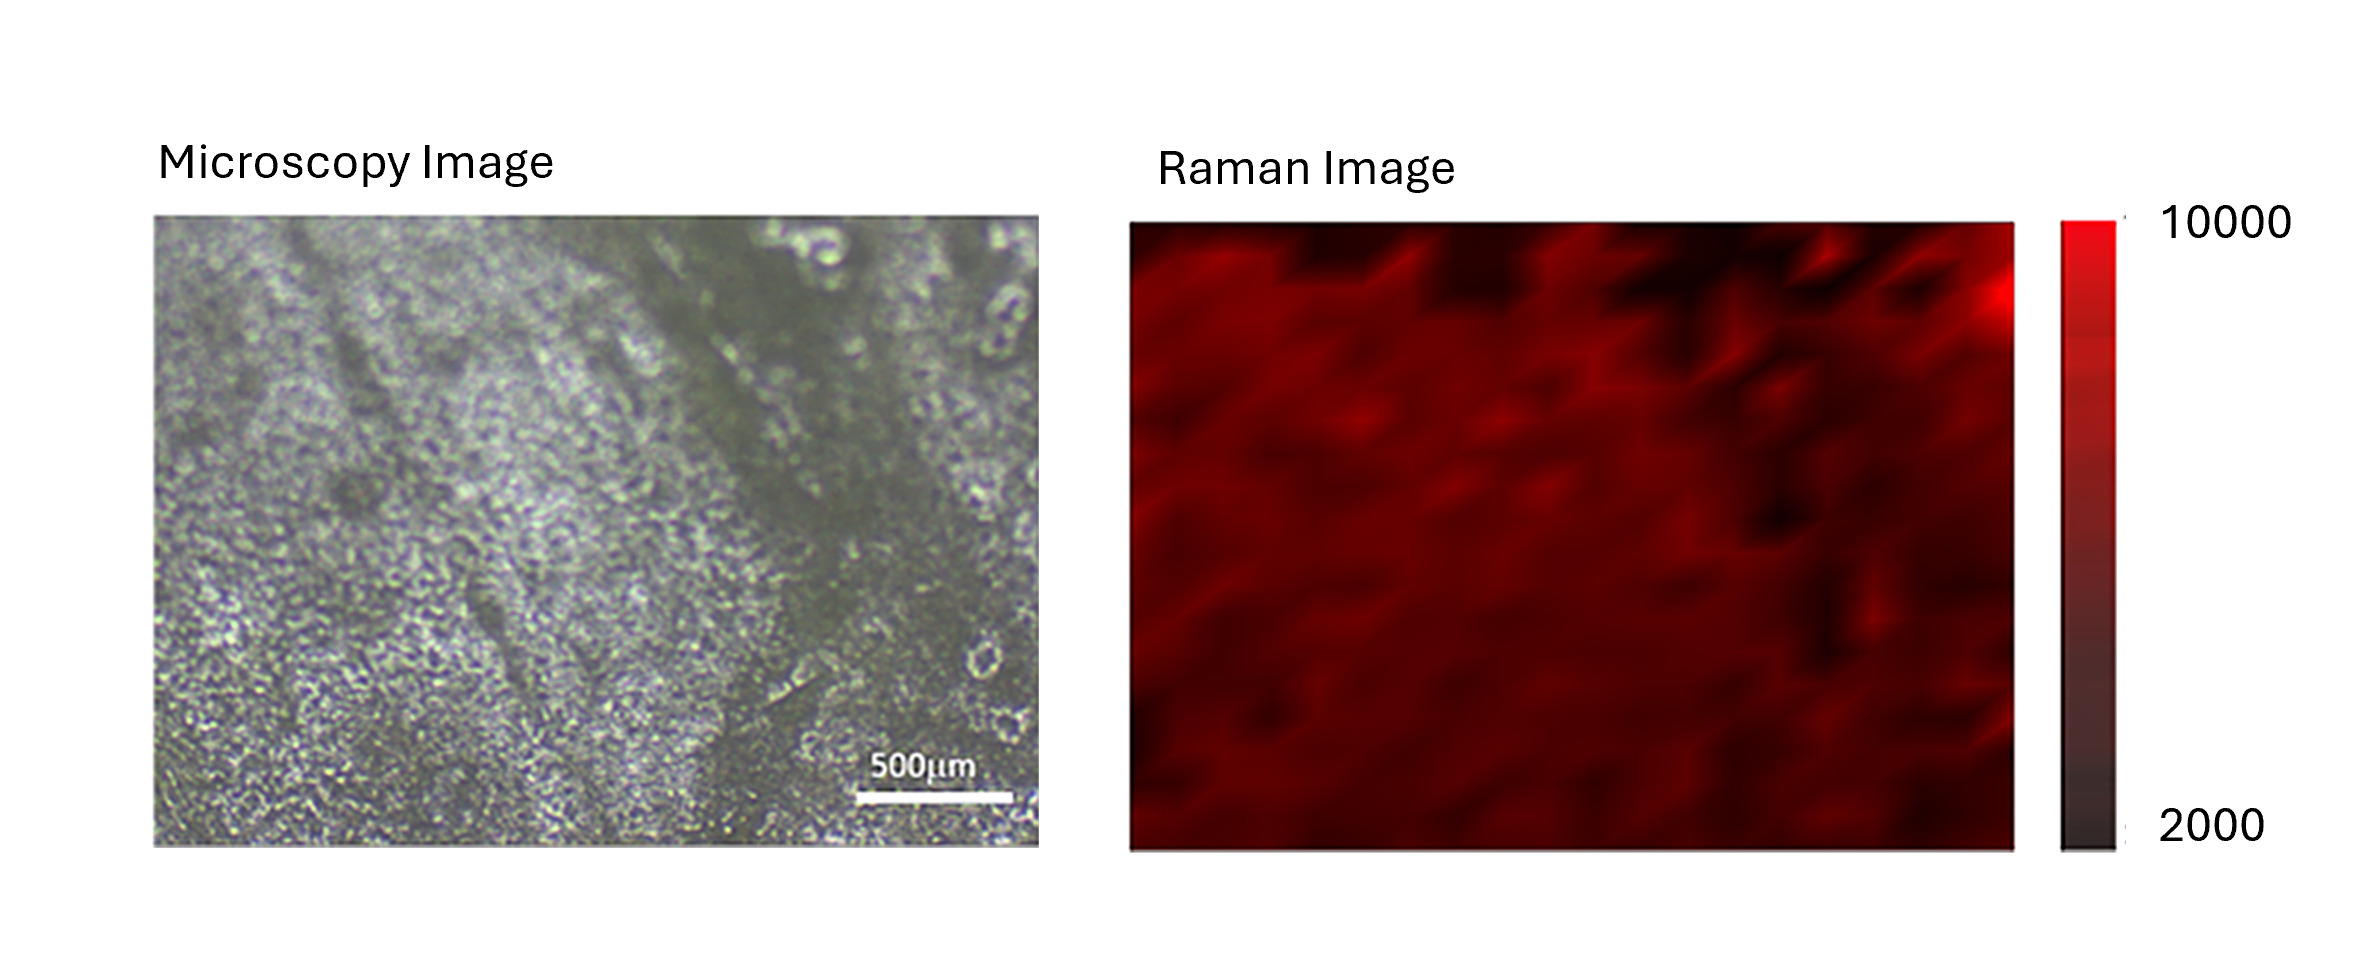
Figure 4. Brightfield image of TPU/10% DIP sample (left panel) and 2D Raman map of the surface based on the intensity of the DIP peak at 1350−1400 cm-1 (right panel).  


Conclusion

This Research Highlight demonstrates the importance of using Raman microscopy for the characterisation of 3D-printed materials for bone tissue engineering. An RM5 Raman microscope allowed for clear identification of the TPU polymer and increasing presence of DIP drug in the higher concentrated (TPU/10% DIP) samples. Furthermore, Raman mapping displayed an even distribution of DIP across the TPU/10% DIP 3D-printed sample. Acquiring such characterisation data is crucial in the development of 3D-printed bone/drug implants before being implemented in patients.  

Full Publication

The results in this Research Highlight were published in Springer Link Nature within the Journal of Drug Delivery and Translational Research. The full article can be found here: https://doi.org/10.1007/s13346-024-01744-1   


References

  1. Domínguez-Robles, E. Utomo, V. A. Cornelius, Q. K. Anjani, A. Korelidou, Z. Gonzalez, R. F. Donnelly, A. Margariti, M. Delgado-Aguilar, Q. Tarrés and E. Larrañeta, Mater. Des., 2022, 220, 110837.
  2.  M. M. Wang, R. L. Flores, L. Witek, A. Torroni, A. Ibrahim, Z. Wang, H. A. Liss, B. N. Cronstein, C. D. Lopez, S. G. Maliha and P. G. Coelho, Sci. Rep., 2019, 9, 18439. 


RELATED PRODUCTS

RMS1000

Multimodal Confocal Microscope

VIEW

RM5

Raman Microscope

VIEW

Contact our expert team today to find out more about how our products can improve your research

Contact Us
PrevPrevious
NextNext
Previous Diffraction Grating Stray Light: What Are Spectral Ghosts? Next Photo- and Radioluminescence of Molybdenum Nanoclusters for Photodynamic Therapy

RESOURCES

Tags:
  • Research Highlight
  • Biomedical
  • RM5
  • RMS1000
  • Raman
Research Highlight
Download PDF
Featured Product:

RM5 Raman Microscope

View more »
Suggested Reading:

Raman Microscopy for Pharmaceutical Analysis

View more »

Discrimination of Bacteria Species Using Raman Microscopy and Principal Component Analysis

View more »
Share:

Keep up to date with the latest from Edinburgh Instruments

Join our mailing list and keep up with our latest videos, app notes and more!

LOCATION:
  • Edinburgh Instruments Ltd.
    2 Bain Square, Kirkton Campus, Livingston, EH54 7DQ.
  • sales@edinst.com
  • +44 1506 425 300
ABOUT:
  • About Us
  • Techniques
  • Applications
  • Knowledgebase
  • About Us
  • Techniques
  • Applications
  • Knowledgebase
PRODUCTS:
  • Fluorescence Spectrometers
  • Raman Microscopes
  • UV-Vis Spectrophotometers
  • Transient Absorption
  • FTIR Spectrometers
  • Lasers and LEDs
  • Customisation Options
  • Software
  • Upgrades
  • All Products
  • Fluorescence Spectrometers
  • Raman Microscopes
  • UV-Vis Spectrophotometers
  • Transient Absorption
  • FTIR Spectrometers
  • Lasers and LEDs
  • Customisation Options
  • Software
  • Upgrades
  • All Products
LEGALS:
  • News
  • Events
  • Blog
  • Careers
  • Contact Us
  • Terms and Conditions
  • Privacy Policy
  • News
  • Events
  • Blog
  • Careers
  • Contact Us
  • Terms and Conditions
  • Privacy Policy
SOCIALS:
Youtube Linkedin X-twitter Facebook
©2024 Edinburgh Instruments. Registered in England and Wales No: 962331. VAT No: GB 271 7379 37
Manage Consent
To provide the best experiences, we use technologies like cookies to store and/or access device information. Consenting to these technologies will allow us to process data such as browsing behaviour or unique IDs on this site. Not consenting or withdrawing consent, may adversely affect certain features and functions.
Functional Always active
The technical storage or access is strictly necessary for the legitimate purpose of enabling the use of a specific service explicitly requested by the subscriber or user, or for the sole purpose of carrying out the transmission of a communication over an electronic communications network.
Preferences
The technical storage or access is necessary for the legitimate purpose of storing preferences that are not requested by the subscriber or user.
Statistics
The technical storage or access that is used exclusively for statistical purposes. The technical storage or access that is used exclusively for anonymous statistical purposes. Without a subpoena, voluntary compliance on the part of your Internet Service Provider, or additional records from a third party, information stored or retrieved for this purpose alone cannot usually be used to identify you.
Marketing
The technical storage or access is required to create user profiles to send advertising, or to track the user on a website or across several websites for similar marketing purposes.
Manage options Manage services Manage {vendor_count} vendors Read more about these purposes
View preferences
{title} {title} {title}