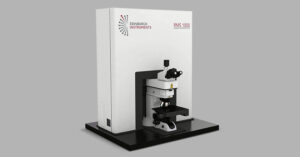
Performing Raman analysis in a multi-well plate enables high-throughput screening for rapid and efficient sample analysis. Ramacle® software includes a multi-well plate function that enables analysis in both standard (e.g. 6, 12, 24, 48, 96 and 384 wells) and custom plates, turning your RM5 Raman Microscope or RMS1000 Multimodal into a fast and efficient plate reader (Figure 1).

Figure 1. Multi-well plate analysis on RMS1000 Confocal Multimodal Microscope.
The multi-well plate module converts a confocal Raman microscope into a high-throughput screening platform while maintaining full spectral performance.
Within Ramacle®, users can:
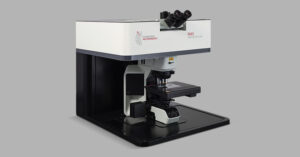
This Technical Note demonstrates how the multi-well plate feature in Ramacle simplifies high-throughput Raman analysis and differentiation of edible cooking oils using the RMS1000 Multimodal Microscope equipped with a motorised stage with plate holder insert (Figure 2).

Figure 2. Multi-well plate stage insert for Edinburgh Instruments Raman microscope.
Four edible oils – olive oil, extra virgin olive oil, sunflower oil and rapeseed oil – were loaded into a 96-well plate, with 300 μL in each well. Each oil was prepared with four replicates; the plate layout is detailed in Figure 3.

Figure 3. 96-well plate layout of edible oil samples.
The multi-well plate analysis feature in Ramacle was used to set up the measurement parameters. In the Layout tab, the type of multi-well plate is selected, and the wells are graphically represented in the software (Figure 4). The user then selects the wells to be analysed. This can include the entire plate or individual wells of interest (Figure 4, wells shown in blue).

Figure 4. Ramacle’s Multi-well Plate Analysis feature. Selecting wells for multi-well plate analysis.
Next, in the Measurement Parameters tab, all Raman parameters can be selected. This includes the laser wavelength, laser power, grating and acquisition time. For the edible oil samples, the optimal measurement parameters are detailed in Table 1.
Table 1. Experimental Parameters for Raman analysis of edible oils.
Parameter Measurement Instrument RMS1000 Laser Wavelength 532 nm Laser Power 100% Grating 600 gr/mm Objective Lens 10x/0.30 NA No of Accumulations 5 Exposure Time 0.1 s
During measurements, the progress of the analysis can be followed. Ramacle displays:
A Raman band at approximately 1660 cm⁻¹, assigned to cis C=C stretching in lipids, was used to visualise signal intensity across the plate as this was common amongst all oil types (Figure 5).

Figure 5. Multi-well acquisition in progress in Ramacle.
Following acquisition, Raman spectra from each well can be visualised directly through the graphical plate interface in Ramacle®, enabling rapid visual comparison of replicates and oil types.
To quantitatively differentiate between the oils, Pearson correlation analysis was performed using a similarity threshold of >99%. This statistical approach evaluates the linear correlation between spectra, allowing samples with highly similar spectral profiles to be grouped automatically.
The correlation analysis clearly distinguished the four oil types based on subtle variations in their Raman fingerprints, despite the presence of common features such as the C=C stretching band at ~1660 cm⁻¹. Replicate measurements of the same oil exhibited strong correlation, demonstrating good reproducibility across the plate. The grouped results were visualised using colour-coded mapping within Ramacle®, providing an immediate and intuitive representation of sample similarity (Figure 6). The average spectra obtained for each oil are also shown in Figure 6, further illustrating the spectral differences between oil types.

Figure 6. Raman results showing Ramacle Pearson correlation analysis to differentiate between oil types: olive oil (yellow), extra virgin olive oil (green), sunflower oil (purple) and rapeseed oil (blue). Average Raman spectra of four replicates of each type of oil.
Ramacle’s multi-well plate module allows laboratories to scale from manual, single-sample analysis to fully automated screening while maintaining the elite spectral performance of a research-grade confocal microscope. By integrating acquisition and analytics into a single workflow, Ramacle removes the “data bottleneck” common in high-volume testing. Table 2 highlights the key benefits of this feature.
Table 2. Benefits of multi-well plate analysis on RM5 or RMS1000.
Capability Benefit Automated Scanning Eliminates need for manual repositioning Replicate consistency Improves data reliability Integrated analysis Ramacle’s analysis tools can be performed immediately after analysis, reducing the data processing time Confocal Raman measurement Maintains spectral resolution and sensitivity compared to conventional plate readers Flexible plate formats Supports research and quality control workflows
The ability to perform automated plate-based Raman screening is particularly valuable for applications including:
High-throughput Raman analysis is increasingly important for laboratories requiring rapid, reproducible screening of large sample sets. This Technical Note demonstrated how the multi-well plate function in Ramacle enables automated, efficient analysis of standard and custom plate formats, significantly reducing manual intervention and measurement time.
Using the RM5 or RMS1000 Confocal Microscopes, edible oils were successfully analysed and differentiated using automated acquisition and Pearson correlation analysis within the software. The ability to define plate layouts, select measurement parameters, monitor acquisition in real time, and perform integrated data analysis within a single platform streamlines the entire workflow from measurement to interpretation.
By transforming a confocal Raman microscope into a high-throughput plate reader, Ramacle enhances productivity while maintaining the spectral quality and analytical power expected from advanced Raman instrumentation.