Skip to content
Skip to content
  • News
  • Events
  • eBooks
  • Blog
  • Careers
  • Contact
  • News
  • Events
  • eBooks
  • Blog
  • Careers
  • Contact
KNOWLEDGEBASE
  • About Us
  • Products

    Fluorescence Spectrometers

    • FLS1000 Photoluminescence Spectrometer
    • FS5 Spectrofluorometer
    • LifeSpec II Lifetime Spectrometer
    • Mini-tau Lifetime Spectrometer

    Raman Microscopes

    • RM5 Raman Microscope
    • RMS1000 Multimodal Confocal Microscope

    Transient Absorption

    • LP980 Transient Absorption Spectrometer

    FTIR Spectrometers

    • IR5 FTIR Spectrometer

    Lasers and LEDs

    • Pulsed Lasers
    • Gas Lasers
    • Customisation Options
    View All Products
  • Techniques
  • Applications
KNOWLEDGEBASE
Edit Content
  • About Us
  • Products
  • Techniques
  • Applications
  • Knowledgebase
  • eBooks
  • News
  • Events
  • Blog
  • Careers
  • Contact Us

RESOURCES

High Pressure Raman Spectroscopy of Piezochromic Materials

  • November 21, 2024

KEY POINTS

  • Raman spectroscopy can reveal pressure-induced structural changes in various materials.
  • Researchers at Nankai University used the Edinburgh Instruments RMS1000 Confocal Multimodal Microscope to identify compression effects from applying varying pressure to a hybrid metal halide crystal.
  • Raman microscopy was used to study the structural changes occurring in the manganese-based organic-inorganic metal halide under high pressure in a diamond anvil cell.
Edit Content

In this Research Highlight, Raman microscopy is used to examine the structural changes occurring in a manganese-based organic-inorganic metal halide under high pressure. By combining a Raman microscope with a diamond anvil cell and adjusting the pressure of the sample, researchers were able to observe uniform octahedral compression of the crystal. This observation enhanced their understanding of the material’s pressure sensing capabilities. 


Introduction  

Organic-inorganic hybrid metal halides (OIMHs) have emerged as promising materials for various applications, including photovoltaics, photoelectric detection, light-emitting diodes, and sensors. Their exceptional optical properties, which can be fine-tuned through structural manipulation, have garnered significant attention, particularly in pressure-induced enhancement and piezochromism. 

Hydrostatic compression of OIMHs results in lattice distortion, leading to decreased interatomic distances and bandgap variation. This causes compression-induced changes in emission wavelength and intensity, meaning the material can be used for pressure sensing. Due to its high sensitivity to perturbations in interatomic distances, Raman microscopy is a powerful technique for studying pressure-induced changes in crystalline materials (Figure 1). It also allows high spatial-resolution interrogation of single crystals within pressure chambers such as diamond anvil cells (DACs).  

the effect of pressure on interatomic distance and vibrational energy

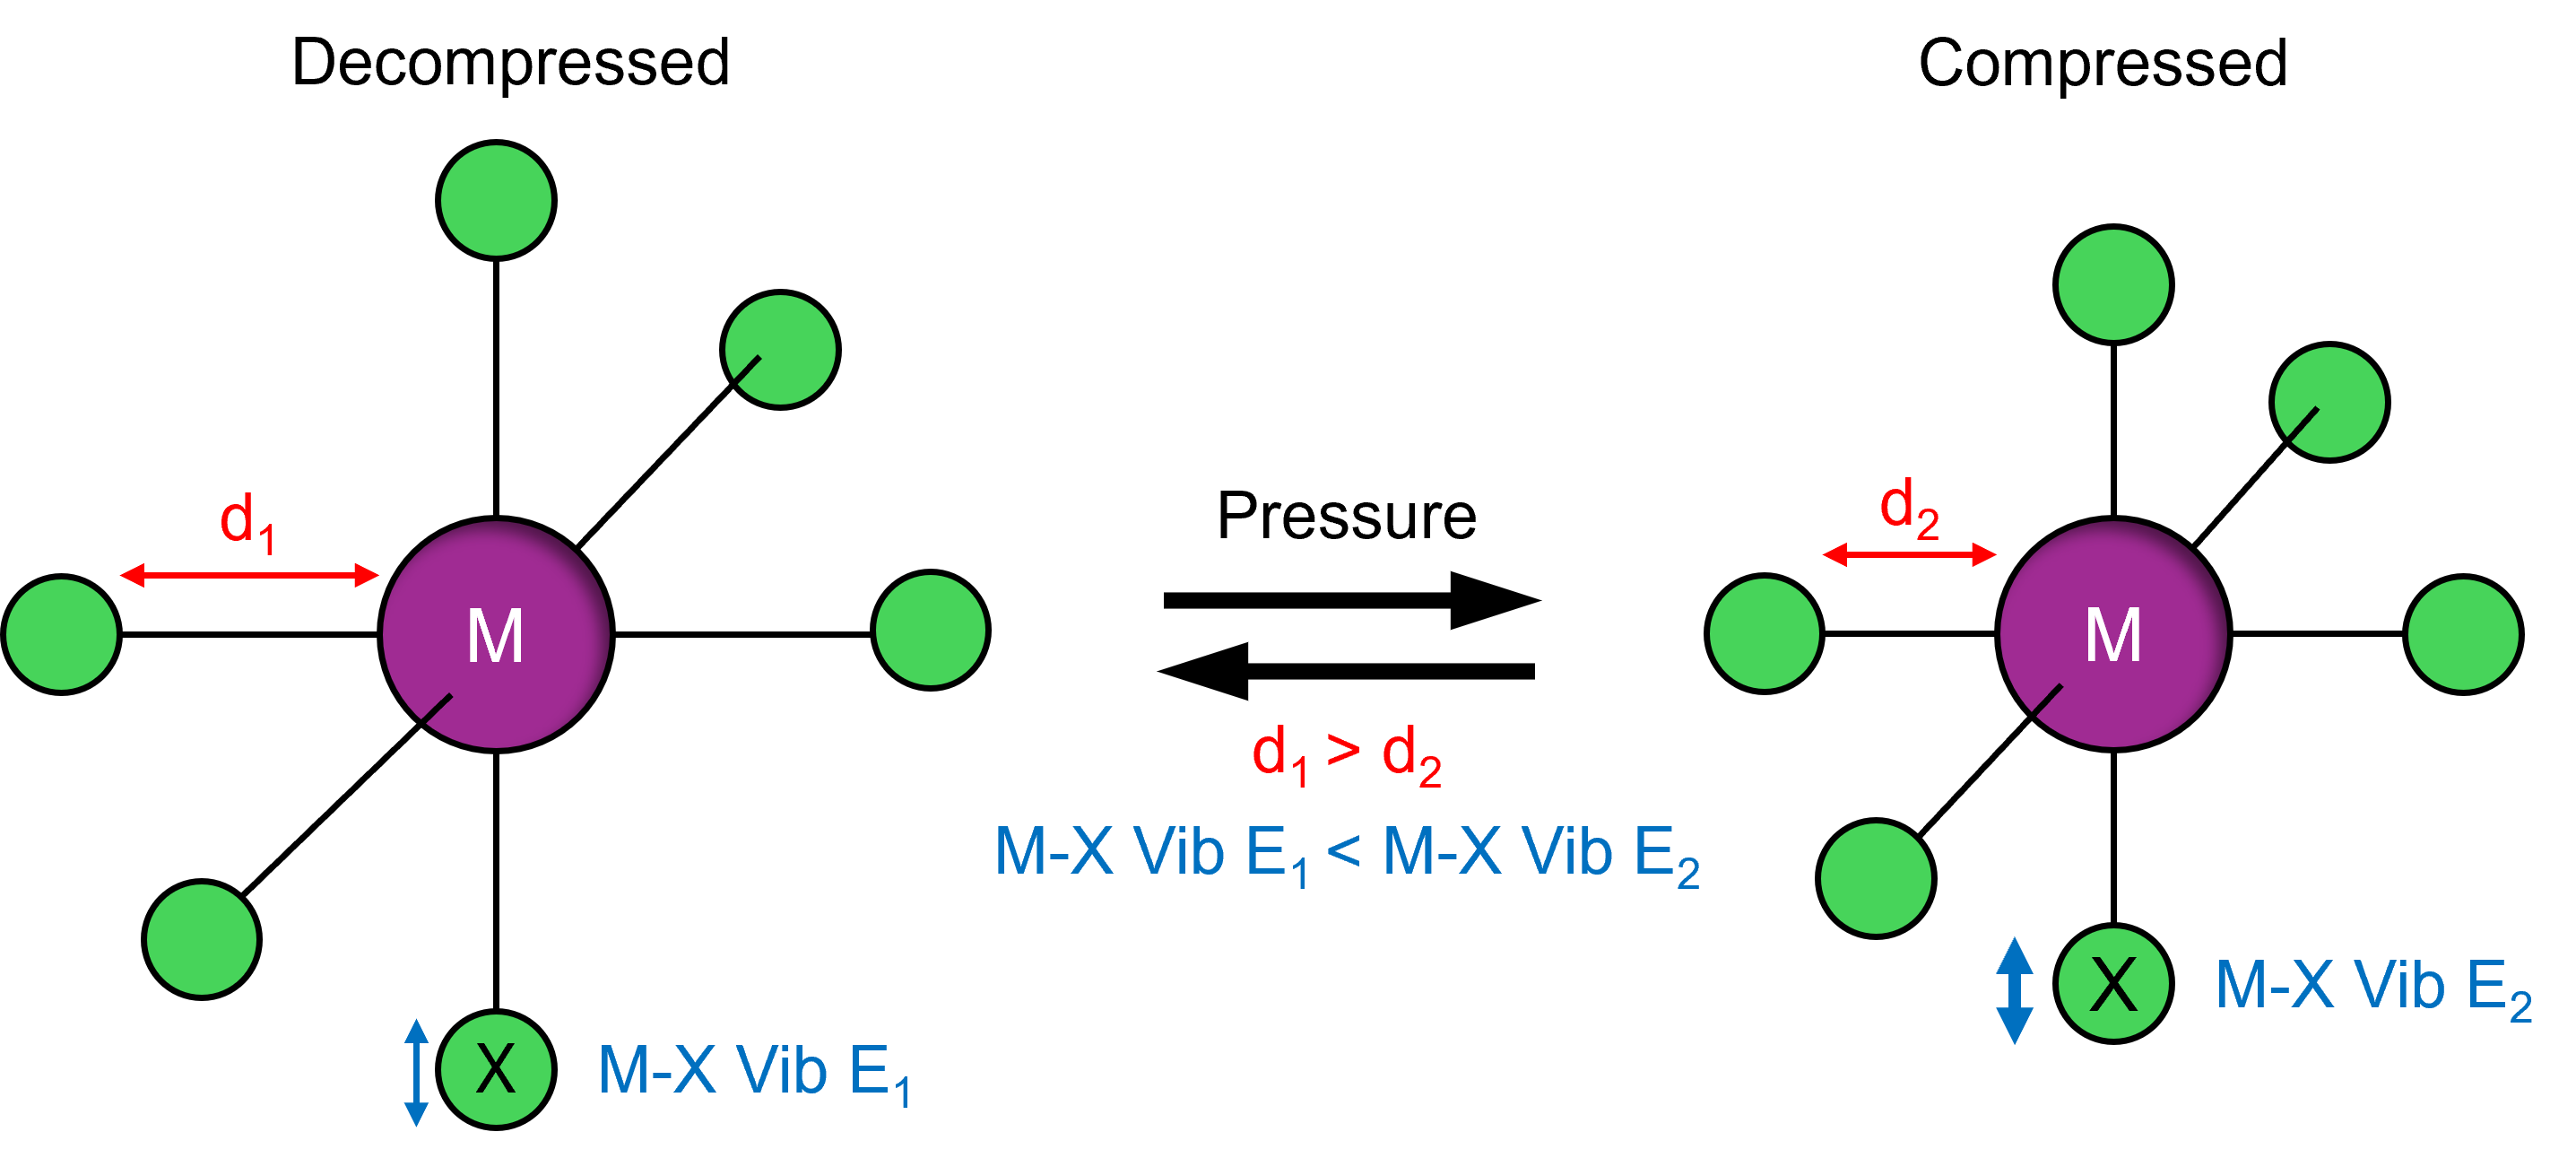
Figure 1. The effect of pressure on interatomic distance and vibrational energy.  


This Research Highlight presents a recent study published in Chemistry of Materials by researchers at Nankai University in Tianjin, China.1 In this work, they used an Edinburgh Instruments RMS1000 Confocal Multimodal Microscope to investigate the pressure-induced piezochromism of an Mn-based OIMH.  


Materials and Methods 

A single crystal of zero–dimensional (0D) (TDMA)MnBr3(H2O)2 [TDMA = (tetrahydrofuran-3-yl) methylamine] was prepared for high-pressure Raman microscopy by placing it in a DAC, as depicted in Figure 2. The DAC comprised a pre-indented stainless-steel gasket sandwiched between two diamonds. Silicone oil was used as the pressure-transmitting medium, while a ruby crystal served for calibration. The DAC containing the sample was placed on the motorised stage of the RMS1000 for analysis.  

sample pressurised in a DAC

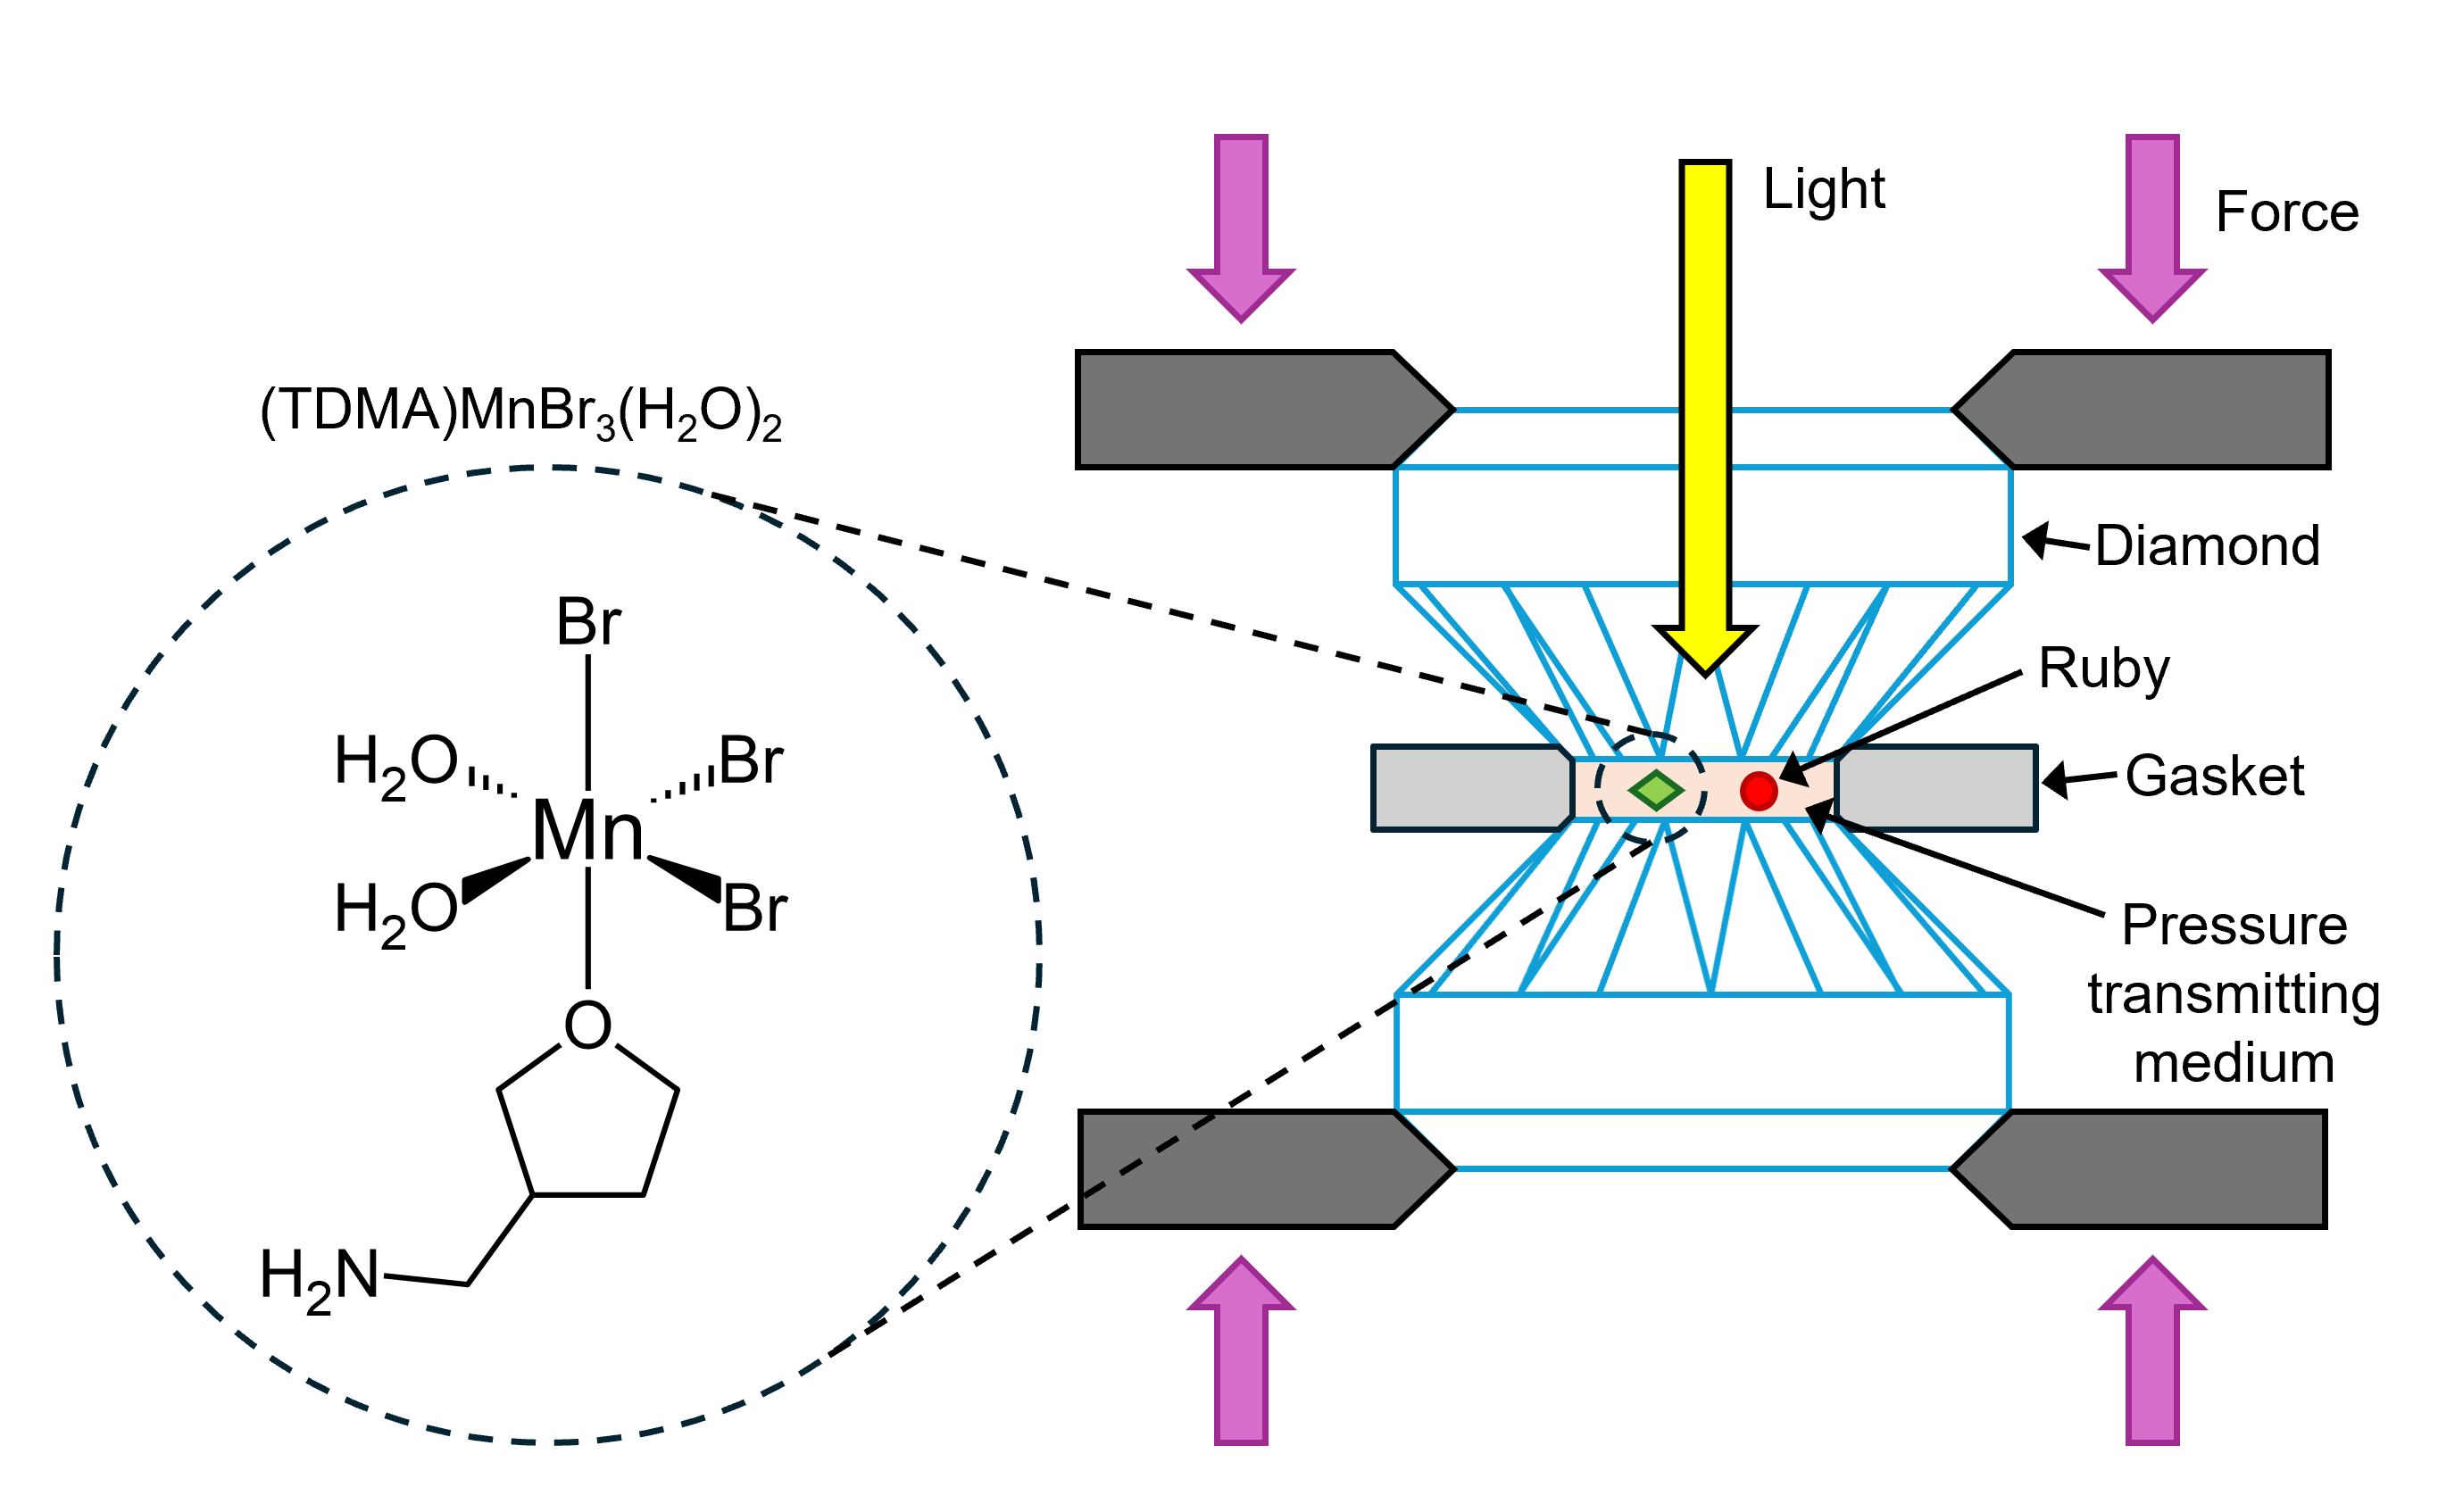
Figure 2. (TDMA)MnBr3(H2O)2 pressurised in a DAC. 


High pressure Raman spectra of the crystal were recorded in the DAC using an RMS1000 equipped with a 785 nm laser, Figure 3. The spectra were recorded at various pressures between 1 atm and 11.4 atm.  

Edinburgh Instruments RMS1000 Confocal Multimodal Microscope

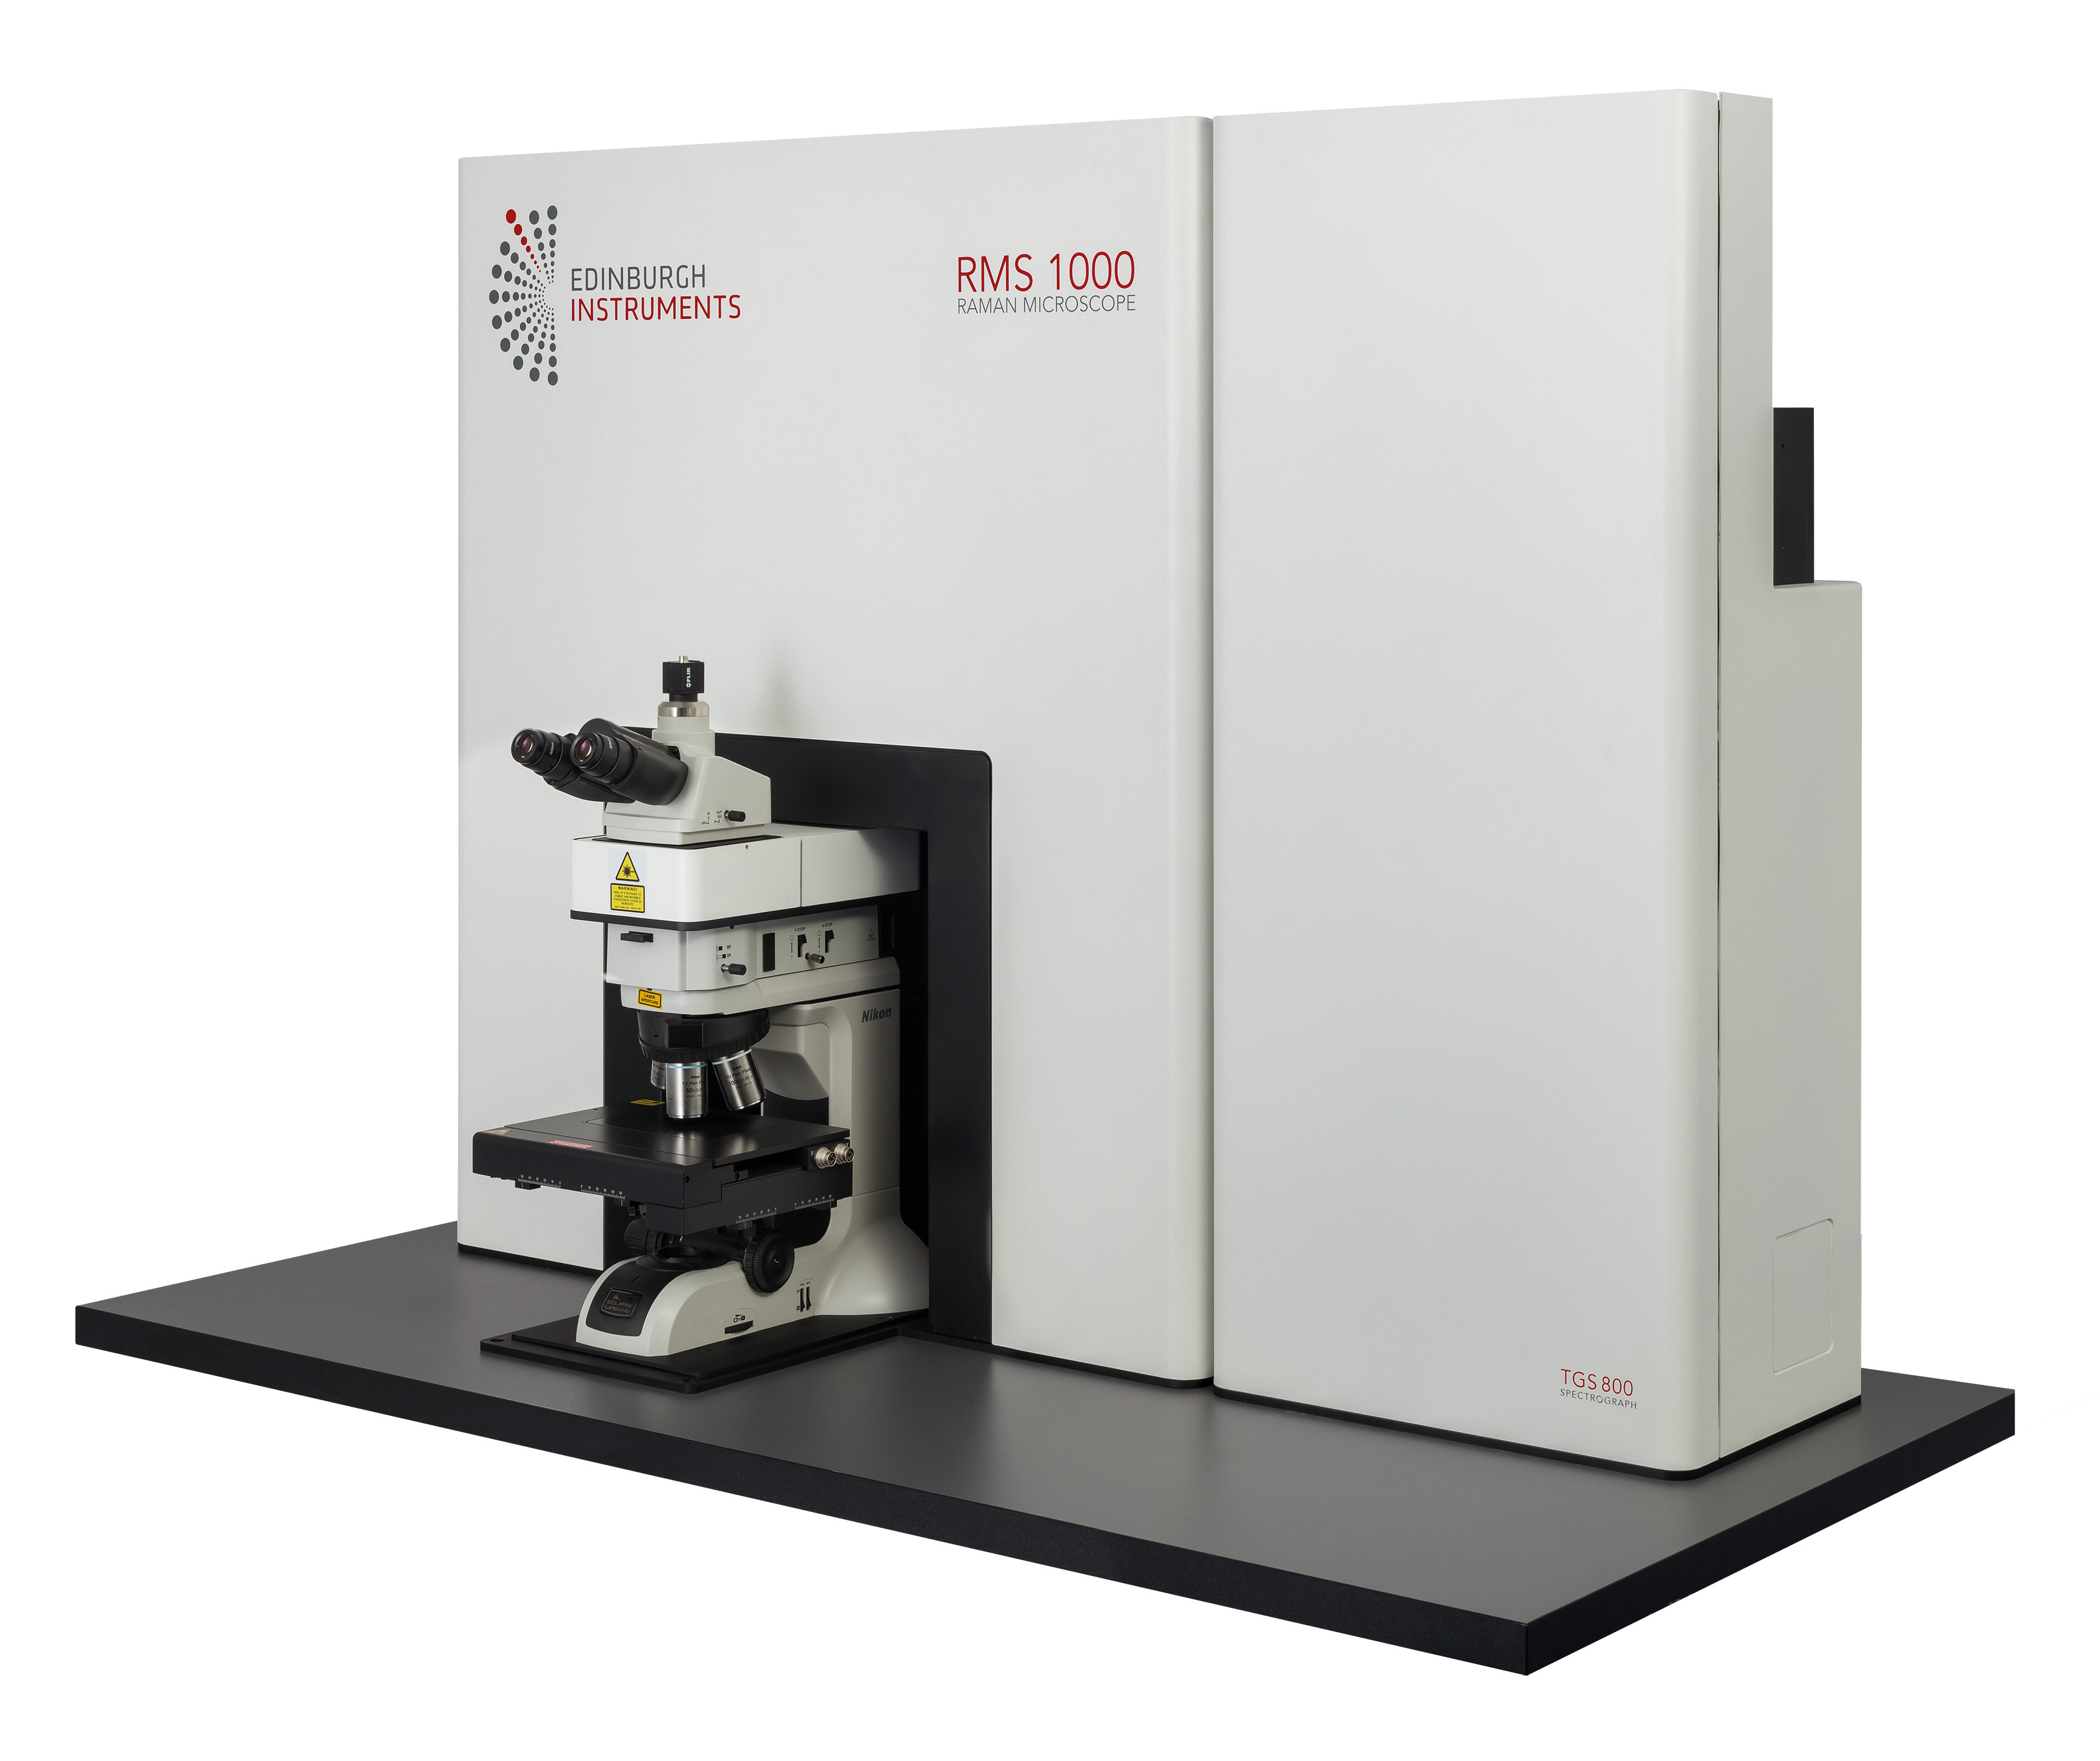
Figure 3. Edinburgh Instruments RMS1000 Confocal Multimodal Microscope. 


High Pressure Raman Spectral Analysis of a (TDMA))MnBr3(H2O)2 Crystal 

To explain why the crystal showed pressure-emission wavelength linearity under compression and decompression, (shown in the article,) the sample was analysed using high pressure Raman spectroscopy.  

Figure 4 shows the Raman spectra acquired from the crystal with increasing pressure. The panel in Figure 4a shows the vibrational modes between 100 cm-1 and 400 cm-1 corresponding to Mn-X (X = Br and O), and Figure 4b displays modes between 600 cm-1 and 1200 cm-1 corresponding to the TDMA ligand.  

Raman spectra under varying pressure

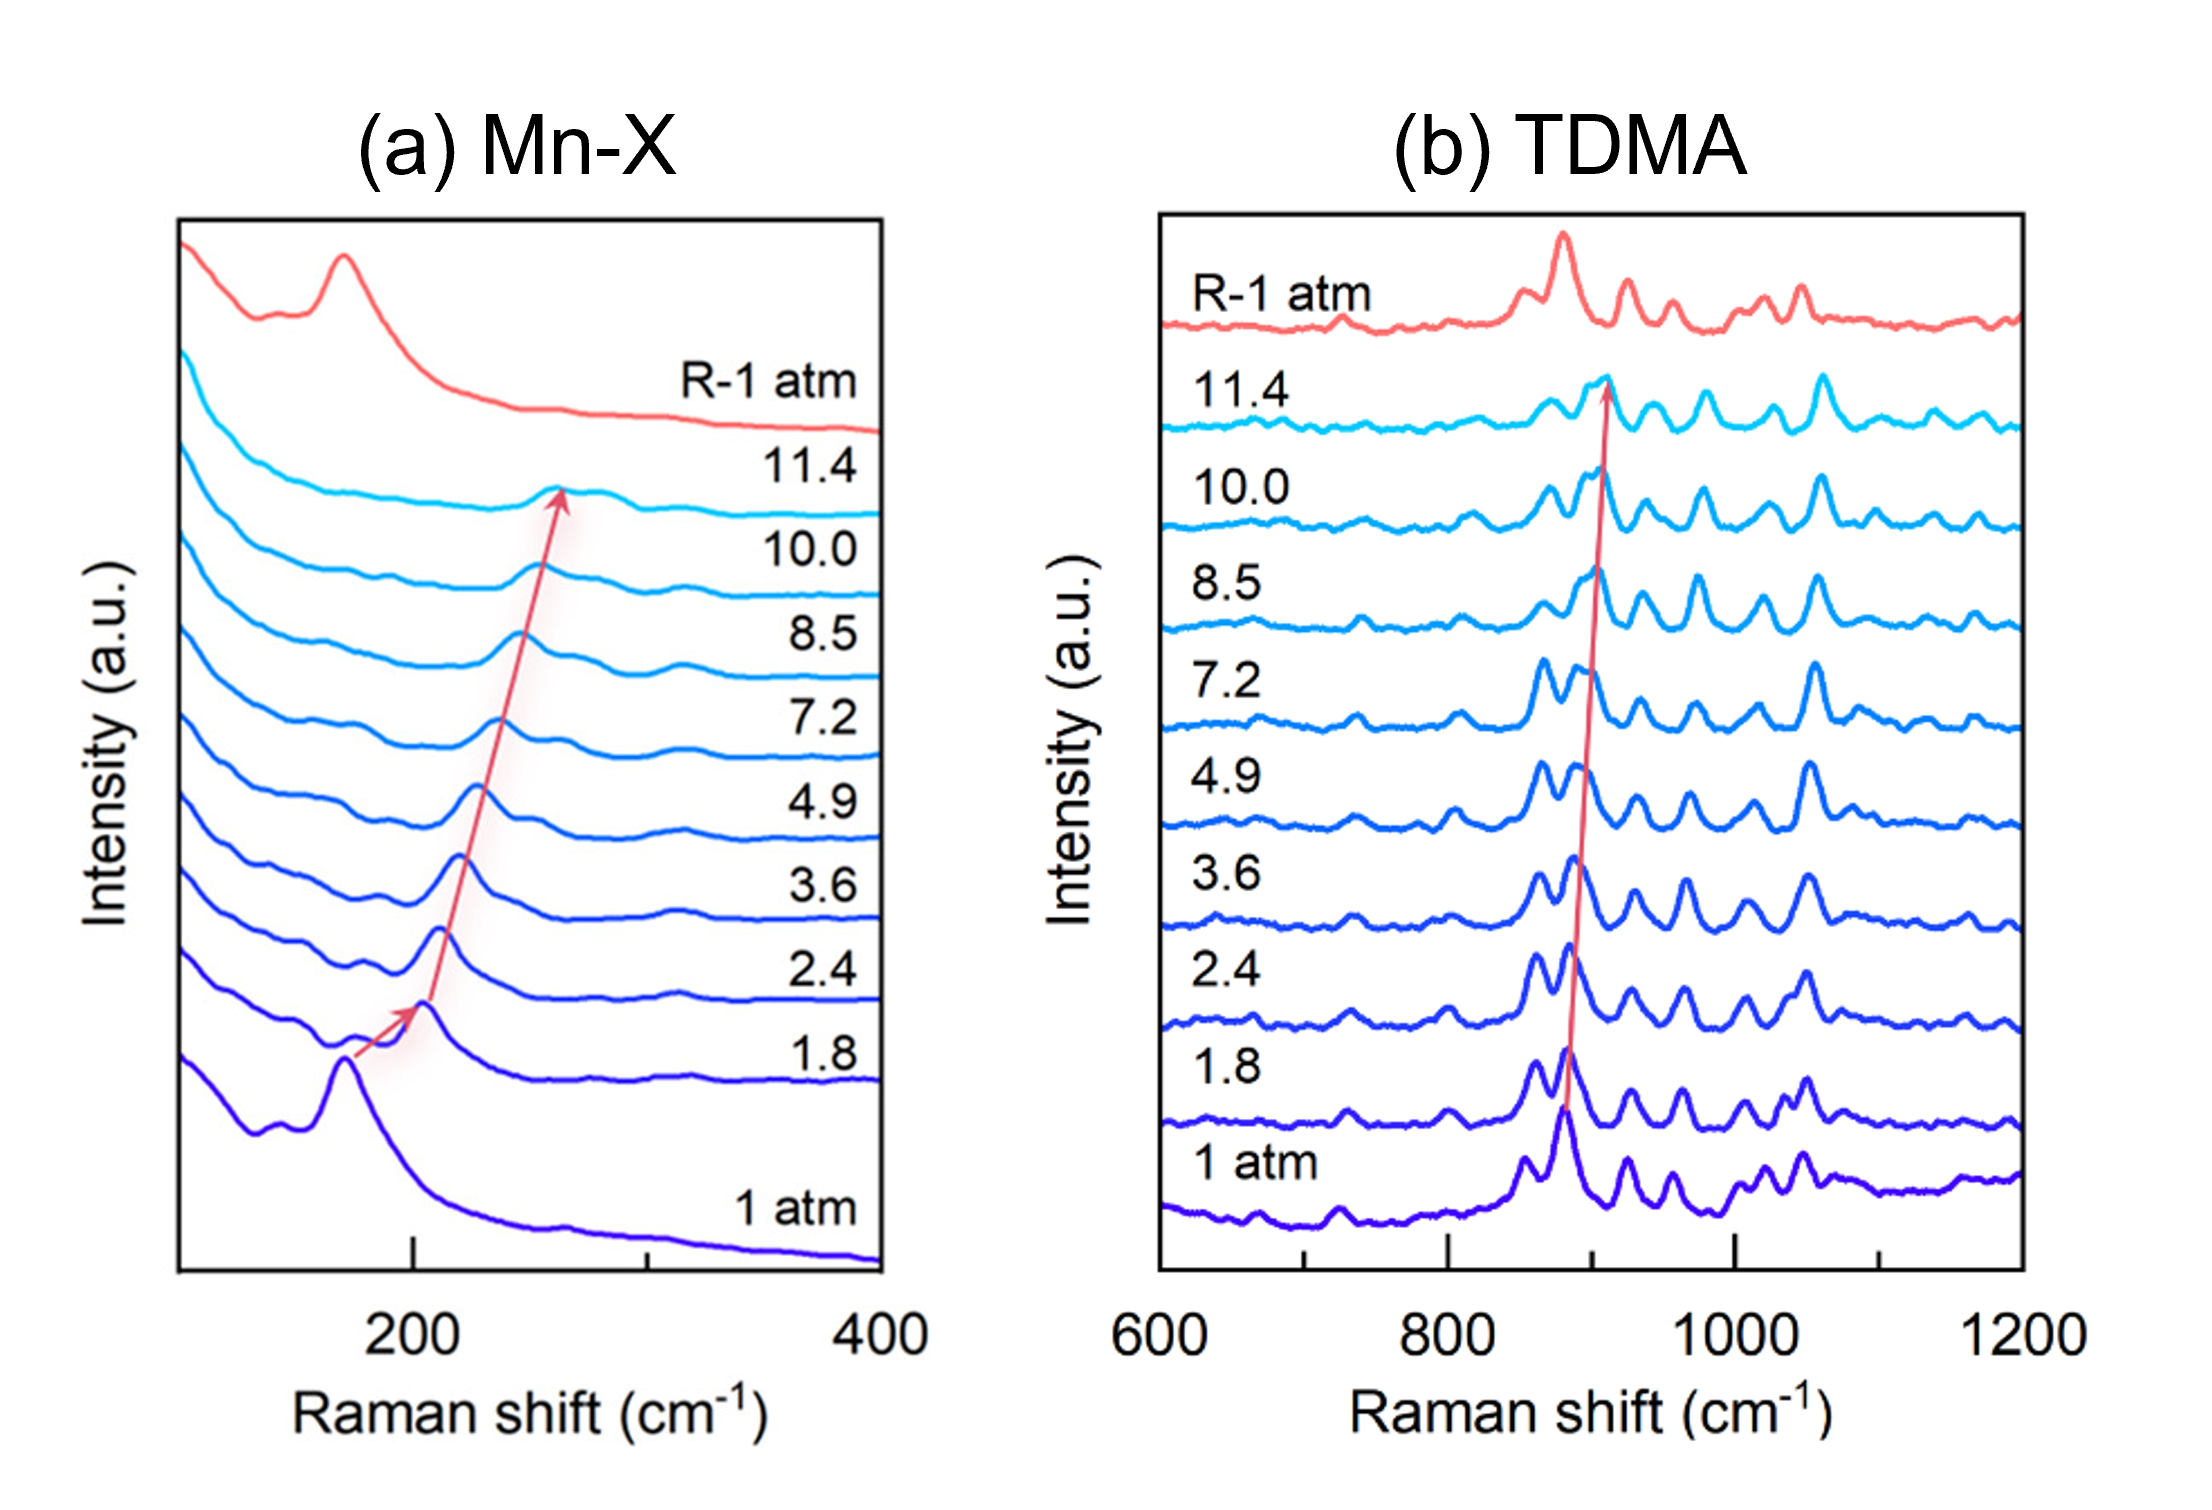
Figure 4. Raman spectra of (TDMA))MnBr3(H2O)2 under varying pressure. The image is reprinted from Zhang et al.1, Copyright (2024), with permission from American Chemical Society.  


It can be seen in both plots that as the pressure increases, the position of all of the vibrational modes on the Raman shift axis also increases. This phenomenon is reversed when the pressure is released. This suggests that the interatomic distances within the octahedral lattice are decreasing; in other words, the octahedral complex is compressing under high pressure. The compression of the octahedra leads to an enhancement of the crystal field splitting of Mn2+, resulting in a decrease in bandgap and a redshift in photoluminescence (shown in the article). The Raman data combined with the pressure-emission wavelength linearity relationship observed indicates homogeneous compression of the octahedral complex rather than a phase transition. The stability of the sample under compression was explained by the large degree of intermolecular hydrogen bonding. Furthermore, the more pronounced peak broadening in the Mn-X region of the Raman spectra was assigned to a larger compression capacity of the [MnBr3(H2O)2]– relative to TDMA+.  


Conclusion 

This Research Highlight shows how an RMS1000 equipped with a DAC can be used to study materials under high pressure. The researchers in the study found a linear relationship between pressure and emission wavelength in (TDMA)MnBr3(H2O)2, indicating the potential of the material for pressure sensing. Raman spectral analysis in a DAC revealed homogeneous compression of the octahedral complex, which helped explain the observed piezochromic effect. 


References 

  1. Y. Zhang et al., Linear Regulation of Red Emission in an Organic-Inorganic Manganese Bromide via Pressure, Chem. Mater., 2024, 36, 3435-3443.  


Full Publication 

The results shown in this Research Highlight were published in Chemistry of Materials. More details can be found here: https://pubs.acs.org/doi/10.1021/acs.chemmater.4c00305?ref=pdf.  


RELATED PRODUCTS

RMS1000

Multimodal Confocal Microscope

VIEW

RM5

Raman Microscope

VIEW

Contact our expert team today to find out more about how our products can improve your research

Contact Us
PrevPrevious
NextNext
Previous Forensic Paint Analysis Using Raman Microscopy Next What is Fluorescence Anisotropy?

RESOURCES

Tags:
  • Research Highlight
  • LEDs and Lighting
  • Photovoltaics
  • Semiconductors
  • RM5
  • RMS1000
  • Raman
Download PDF
Featured Product:

RMS1000 Raman Microscope

View more »
Suggested Reading:

High Pressure Spectral and Time-Resolved Photoluminescence of Halide Perovskite Crystals with a Diamond Anvil Cell

View more »
Share:

Keep up to date with the latest from Edinburgh Instruments

Join our mailing list and keep up with our latest videos, app notes and more!

LOCATION:
  • Edinburgh Instruments Ltd.
    2 Bain Square, Kirkton Campus, Livingston, EH54 7DQ.
  • sales@edinst.com
  • +44 1506 425 300
ABOUT:
  • About Us
  • Techniques
  • Applications
  • Knowledgebase
  • About Us
  • Techniques
  • Applications
  • Knowledgebase
PRODUCTS:
  • Fluorescence Spectrometers
  • Raman Microscopes
  • UV-Vis Spectrophotometers
  • Transient Absorption
  • FTIR Spectrometers
  • Lasers and LEDs
  • Customisation Options
  • Software
  • Upgrades
  • All Products
  • Fluorescence Spectrometers
  • Raman Microscopes
  • UV-Vis Spectrophotometers
  • Transient Absorption
  • FTIR Spectrometers
  • Lasers and LEDs
  • Customisation Options
  • Software
  • Upgrades
  • All Products
LEGALS:
  • News
  • Events
  • Blog
  • Careers
  • Contact Us
  • Terms and Conditions
  • Privacy Policy
  • News
  • Events
  • Blog
  • Careers
  • Contact Us
  • Terms and Conditions
  • Privacy Policy
SOCIALS:
Youtube Linkedin X-twitter Facebook
©2024 Edinburgh Instruments. Registered in England and Wales No: 962331. VAT No: GB 271 7379 37
Manage Consent
To provide the best experiences, we use technologies like cookies to store and/or access device information. Consenting to these technologies will allow us to process data such as browsing behaviour or unique IDs on this site. Not consenting or withdrawing consent, may adversely affect certain features and functions.
Functional Always active
The technical storage or access is strictly necessary for the legitimate purpose of enabling the use of a specific service explicitly requested by the subscriber or user, or for the sole purpose of carrying out the transmission of a communication over an electronic communications network.
Preferences
The technical storage or access is necessary for the legitimate purpose of storing preferences that are not requested by the subscriber or user.
Statistics
The technical storage or access that is used exclusively for statistical purposes. The technical storage or access that is used exclusively for anonymous statistical purposes. Without a subpoena, voluntary compliance on the part of your Internet Service Provider, or additional records from a third party, information stored or retrieved for this purpose alone cannot usually be used to identify you.
Marketing
The technical storage or access is required to create user profiles to send advertising, or to track the user on a website or across several websites for similar marketing purposes.
Manage options Manage services Manage {vendor_count} vendors Read more about these purposes
View preferences
{title} {title} {title}