Hybrid organic-inorganic halide perovskite semiconductors show excellent promise as optoelectronic devices due to their high performance, solution processability, low cost and tunability. They have received widespread attention as light harvesters in photovoltaic cells thanks to the rapid rise of cell efficiencies and their potential of providing high efficiency low cost solar power.1,2 In addition to their remarkable photovoltaic performance, halide perovskites have also been found to have excellent light emitting properties and are being extensively researched as a new class of solid-state light emitters.3-5

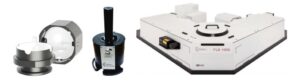
Figure 1. FLS1000 Photoluminescence Spectrometer with double excitation and emission monochromators and TCSPC lifetime option.
One particularly promising application of perovskites is the creation of a solid-state white-light emitter. In current commercially available solid-state white-light sources, a combination of multiple light emitting diodes and phosphor coatings must be used to generate the white emission.4 However, this multicomponent approach is problematic as the components age at different rates and the colour will therefore drift over time. Two-dimensional (2D) halide perovskites are a promising material for the creation of a single component solid-state white-light source.4 In this application note, the properties of a white-light emitting 2D perovskite are characterised with steady state and time-resolved photoluminescence spectroscopy using an FLS1000 Photoluminescence Spectrometer.
Traditional halide perovskites are three-dimensional with an ABX3 crystal structure; where A and B are two different cations and X is the anion. By altering the choice of cations and anions which make up the structure, the properties can be tuned over a wide range; which makes perovskites a highly versatile material. There is now increasing interest in so-called 2D or layered perovskites, with an A2BX4 or ABX4 crystal structure; where the size of the A cation is made so large as to reduce the dimensionality of the structure. An example of a 2D perovskite is α-(DMEN)PbBr4 which is a promising white-light emitter; the structure of which is shown in Figure 2.3 In α-(DMEN)PbBr4, the large 2-(Dimethylamino)-ethylamine (DMEN) cations separate the Pb-Br octahedra into sheets, creating a quasi 2D system.

Figure 2. Crystal structure of α-(DMEN)PbBr4 and the organic cation 2-(Dimethylamino)ethylamine. Image adapted from Mao et al. and Smith et al.3,4
The move from 3D to 2D has a profound influence on the photophysical properties of the perovskite. In 3D perovskites the polarisable 3D lattice screens the electrostatic attraction between photogenerated electron-hole pairs, resulting in free electrons and holes. In contrast; the layered structure of 2D perovskites confines the photoexcited electrons and holes, resulting in strongly bound electron-hole pairs called excitons. It is self-trapping of these excitons that is thought to be responsible for the white-light emission in these systems.4 Photoluminescence spectroscopy is a powerful tool to better understand the photophysics of excitonic perovskites and drive further development.
α-(DMEN)PbBr4 was synthesised using the route described in Mao et al.3 Photoluminescence emission spectra and decays were measured on an FLS1000 Photoluminescence Spectrometer equipped with double monochromators, a 450 W Xenon lamp, EPLED-255 pulsed light emitting diode, EPL-405 pulsed diode laser and a PMT-980 detector. The perovskite sample was positioned using the N-J03 front-face sample holder.
The α-(DMEN)PbBr4 sample was excited at 280 nm and the photoluminescence emission (PL) spectrum measured, as shown in Figure 3. Perovskite samples typically have low quantum yields, which can make obtaining an accurate PL spectrum a challenge. The PL spectrum in Figure 3 was therefore measured on an FLS1000 with a double monochromator on both the excitation and emission light paths. Double monochromators are essential for a highly scattering, low quantum yield sample like perovskite as they enable the PL to be isolated from the Rayleigh scattered excitation light, allowing an accurate spectrum to be obtained. It can be seen that the emission from α-(DMEN)PbBr4 is extremely broad, extending from 400 nm to 930 nm with a maximum at 600 nm.

Figure 3. Photoluminescence emission spectrum of α-(DMEN)PbBr4 excited at 280 nm. Excitation source = 450 W Xenon Lamp, λex = 280 nm, Δλex = 10 nm, Δλem = 2 nm. The spectrum has been spectrally corrected to account for the monochromator and detector wavelength response.
The properties of the α-(DMEN)PbBr4 emission is most easily visualised using a chromacity plot. The Fluoracle software of the FLS1000 has a built-in wizard to generate a chromacity plot from any emission spectrum, in either CIE 1931 or CIE 1976 colour space. The chromacity plot of the α-(DMEN)PbBr4 emission was calculated in CIE 1931 colour space and shown in Figure 4. The emission of α-(DMEN)PbBr4 has CIE 1931 coordinates of 0.39, 0.40 which is close to the ‘pure white’ point of 0.33, 0.33; and is therefore a promising direction for the creation of a solid-state white-light emitter.

Figure 4. Chromacity plot of α-(DMEN)PbBr4 emission in CIE 1931 colour space, calculated using Fluoracle from the emission spectrum in Figure 3. The white point (0.33, 0.33) is shown as a reference.
To better understand the origin of the white-light emission in α-(DMEN)PbBr4, the PL decay was measured using time-correlated single photon counting (TCSPC). The PL decays at λem = 600 nm when α-(DMEN)PbBr4 is excited at 255 nm and 405 nm are shown in Figure 5. Due to the inhomogeneous nature of perovskites, the PL lifetime does not have a single well defined decay constant and the PL decays therefore cannot be fit using simple exponentials.7 Instead, stretched exponential fitting is more appropriate as it takes into account the distribution of recombination rates that are typically present in perovskites.6-8 Edinburgh Instruments offers the FAST software package for analysing complex decays. FAST contains a selection of advanced analysis options such as Förster kinetics, time-resolved anisotropy and stretched exponential analysis.
A stretched exponential decay can be written as,
 | (1) |
where I(t) is the fluorescence intensity at time t, n is the number of components, Ii is the initial intensity, τi is the characteristic lifetime and βi is the stretching exponent (0 < βi ≤ 1 ) of each component. As the value of β is lowered, the exponential is deformed such that the initial decay is faster and the tail longer. The PL decays in Figure 5 were fit with two-component stretched exponentials (stretched biexponentials) using FAST.

Figure 5. PL decays of α-(DMEN)PbBr4 when excited at 255 nm and 405 nm and measured using TCSPC. The PL decays were fit with two component stretched exponentials and the weighted mean lifetime calculated. Excitation source = EPLED-255 Pulsed Light Emitting Diode & EPL-405 Pulsed Diode Laser, Rep Rate = 200 kHz, λem = 600 nm, Δλem = 15 nm.
As stretched exponentials do not have a well-defined decay constant, their lifetime is best described using the mean relaxation time ‹τ› of the decay,8,9
 | (2) |
where Γ (1/β) is the gamma function,7,8
 | (3) |
In the case of multicomponent stretched exponentials, the mean relaxation time of each component is first determined and the weighted mean relaxation time of all components then calculated.
It can be seen from Figure 5 that the PL decay of α-(DMEN)PbBr4 is profoundly influenced by the choice of excitation wavelength. When excited at 255 nm the PL decay of the perovskite has a weighted mean relaxation time of ‹τ›225= 8 ns. In contrast, excitation at 405 nm results in a much prompter decay with a weighted mean relaxation time of ‹τ›405 = 1 ns, but with a longer tail region. The dependence of PL lifetime on the excitation wavelength suggests that there may be a multitude of excited states, with different lifetimes, responsible for the white-light emission.
Accurately determining the photophysical properties of perovskite emitters such as α-(DMEN)PbBr4 can be challenging. Using the FLS1000 Photoluminescence Spectrometer with double excitation and emission monochromators enables accurate emission spectra to be obtained. The emission spectrum revealed that α-(DMEN)PbBr4 emits over a broad wavelength range, 400 nm to 930 nm, and is therefore white-light emitting. From the emission spectrum the CIE 1931 chromacity coordinates were calculated to be 0.39, 0.40 which is close to the pure white coordinates of 0.33, 0.33. The PL lifetime was measured using TCSPC and was found to be excitation wavelength dependent. The PL decays were fit with stretched exponentials using FAST, with mean relaxation times of 8 ns and 1 ns when excited at 255 nm and 405 nm respectively.
Acknowledgements
We are grateful to Ms. L. Mao, Dr. I. Hadar and Prof. M. G. Kanatzidis from Northwestern University for providing the α-(DMEN)PbBr4 sample used in this study.
References