Skip to content
Skip to content
  • News
  • Events
  • eBooks
  • Blog
  • Careers
  • Contact
  • News
  • Events
  • eBooks
  • Blog
  • Careers
  • Contact
KNOWLEDGEBASE
  • About Us
  • Products

    Fluorescence Spectrometers

    • FLS1000 Photoluminescence Spectrometer
    • FS5 Spectrofluorometer
    • LifeSpec II Lifetime Spectrometer
    • Mini-tau Lifetime Spectrometer

    Raman Microscopes

    • RM5 Raman Microscope
    • RMS1000 Multimodal Confocal Microscope

    Transient Absorption

    • LP980 Transient Absorption Spectrometer

    FTIR Spectrometers

    • IR5 FTIR Spectrometer

    Lasers and LEDs

    • Pulsed Lasers
    • Gas Lasers
    • Customisation Options
    View All Products
  • Techniques
  • Applications
KNOWLEDGEBASE
Edit Content
  • About Us
  • Products
  • Techniques
  • Applications
  • Knowledgebase
  • eBooks
  • News
  • Events
  • Blog
  • Careers
  • Contact Us

RESOURCES

Characterisation of NIR PbS Quantum Dots Using the FLS1000 Photoluminescence Spectrometer

  • December 6, 2023

KEY POINTS

  • The FLS1000 Photoluminescence Spectrometer equipped with a photon counting NIR PMT detector can fully characterise the photoluminescence properties of NIR emitters.
  • NIR Absorption and photoluminescence Spectra acquired.
  • Photoluminescence lifetime determined using multichannel scaling to be 1.5 µs.
  • Quantum yield was calculated to be 49.9% using the Integrating Sphere accessory for the FLS1000.
Edit Content

Quantum dots (QDs) are semiconductor particles of varying nanometre sizes with tuneable photoluminescent (PL) properties. Their wide appeal in sensing modalities has been explored for applications ranging from the enhancement of silicon photodetectors, cortisol sensing, fluorescence-guided surgery to wastewater processing, even extending into the NIR due to their exceptional brightness. 1–4 Fluorescence imaging in the near-infrared (NIR) is an attractive modality for biological samples due to the low attenuation of light in this spectral window and increased tissue penetration.4

Lead sulfide (PbS) QDs have been utilised for non-invasive deep-tissue imaging of living mice.5 Their tuneable emission characteristics are controlled by capping with amphiphilic molecules, which support the stabilisation of small-sized nanoparticles, preventing uncontrolled growth.6  A complete photophysical characterisation is required to aid in the development of brighter PL probes and optimise their functionality. In this application note, PbS QDs are fully characterised; with spectral, quantum yield, and PL lifetime determination, using the FLS1000 Photoluminescence Spectrometer.

Materials and Methods

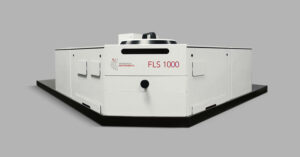
PbS quantum dots were acquired from Quantum Solutions. Dispersions were prepared in tetrachloroethylene (PCE) (anhydrous, Sigma). Samples were loaded into 10 mm pathlength 4-sided quartz cuvettes. The DS5 UV-Vis Spectrophotometer was used to measure the absorption spectrum of the PbS quantum dots. PL characterisation was carried out using the FLS1000 Photoluminescence Spectrometer (Figure 1).

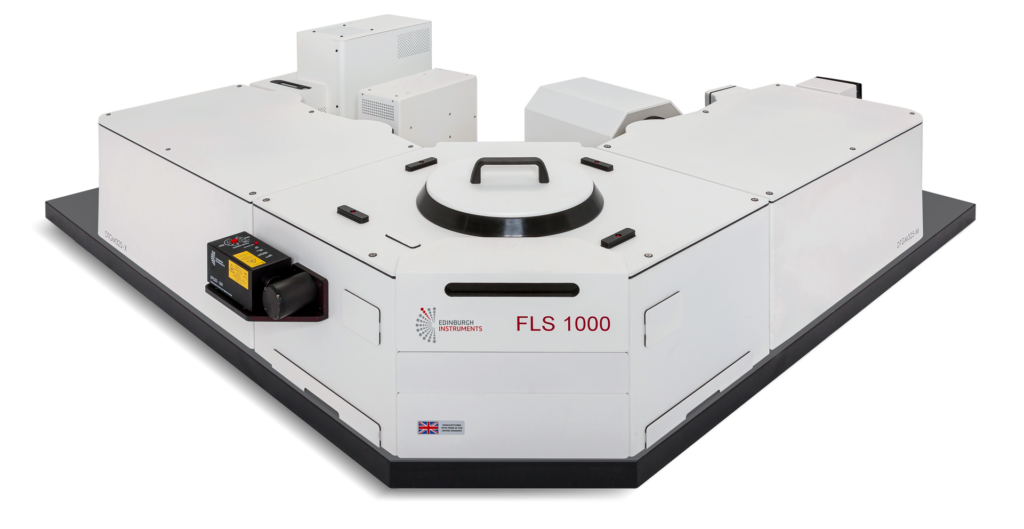
Figure 1. FLS1000 Photoluminescence Spectrometer.

The FLS1000 was equipped with a 450 W Xenon Lamp, single excitation and single emission monochromators and a photon counting liquid nitrogen-cooled (LN2) PMT-1700 NIR detector. For lifetime measurements, the system was equipped with multi-channel scaling (MCS) single photon counting lifetime electronics and an HPL-670 pulsed diode laser. The sample was held in the standard cuvette holder for spectral and lifetime measurements, and an integrating sphere was used to determine the quantum yield.

Absorption and Emission Spectra

The absorption and emission spectra of PbS QDs were measured using the DS5 and FLS1000, respectively, and shown in Figure 2. The absorption spectrum shows strong absorption in the visible that decreases towards longer wavelengths, followed by an absorption peak in the NIR at 1050 nm. Due to the absorption peak at 1050 nm, the sample absorbance was kept below 0.10 at 1050 nm to minimise reabsorption effects on the rising edge of the PL spectrum.


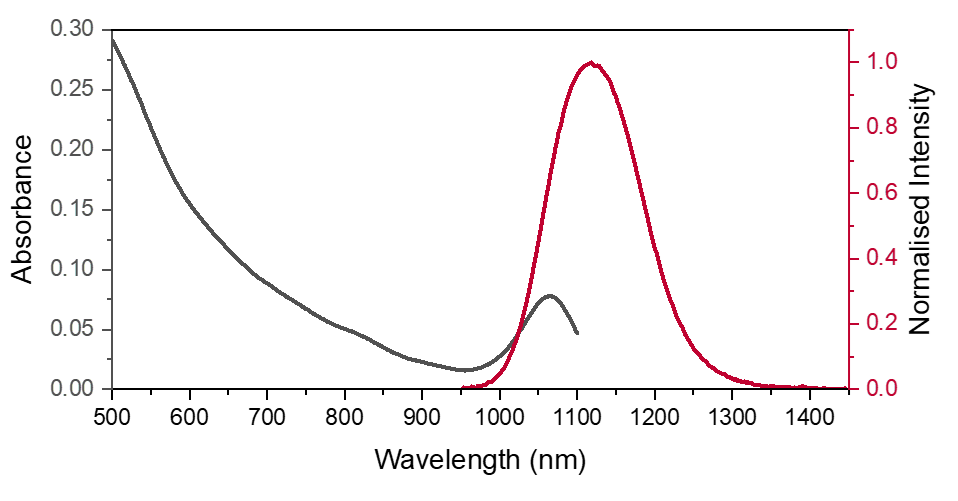
Figure 2. Absorption spectrum for PbS quantum dots in PCE measured on the DS5 from 500-1100 nm (black). Normalised emission spectrum for PbS quantum dots in PCE (red). The emission spectrum was collected following excitation at 670 nm.

Quantum Yield using an Integrating Sphere

The photoluminescence quantum yield (PLQY) of the NIR dots was measured using an integrating sphere (Figure 3). The Integrating sphere enables the quantum yield of solid and liquid samples to be measured without a reference sample of known PLQY. This is particularly advantageous in the NIR where there are no reference standards.

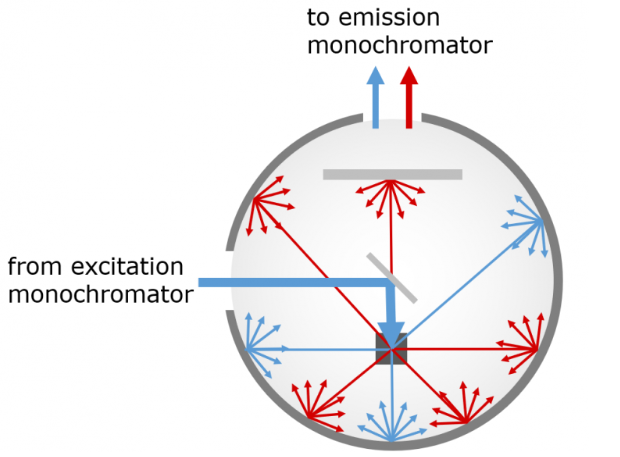
Figure 3. Operating principle of an integrating sphere for absolute PLQY. Excitation light is shown in blue, and PL in red.

Spectra of the scatter and photoluminescence of the PbS QD cuvette and a cuvette containing the PCE solvent (blank) were acquired using the FLS1000 (Figure 4).

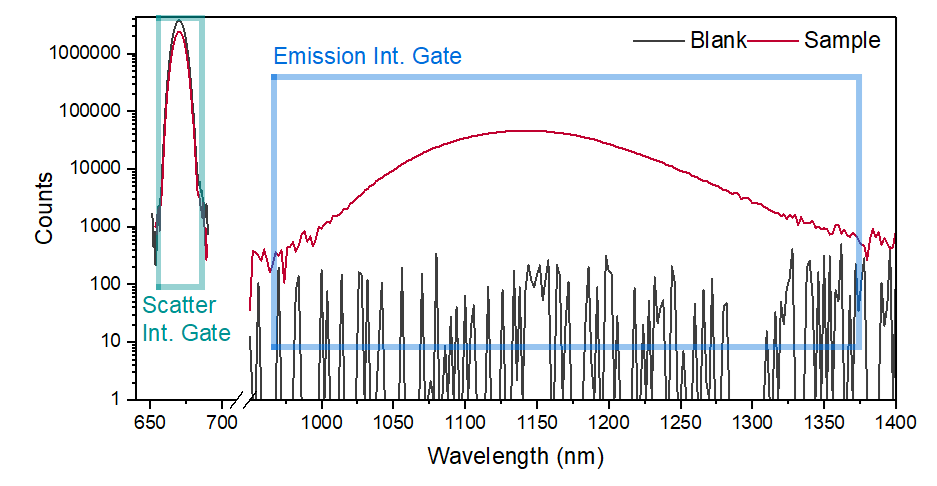
Figure 4. Spectra for calculating the PLQY of PbS quantum dots in PCE (red) and solvent blank (black). Negative and zero values are displayed as 1 on a logarithmic plot. The range integrated for the scattering peak is highlighted in teal, and the integration range for the emission peak is highlighted in blue.

By calculating the ratio of the integrated intensity of the NIR emission to the integrated intensity of absorbed light at 670 nm, the PLQY can be determined using:

where E is the integrated emission intensity, and S is the integrated scattering intensity for the sample (S) and reference blank (R), respectively. Using the Fluoracle quantum yield wizard, the PLQY of the PbS quantum dots was determined to be 49.9±0.2% with error calculated as the standard deviation across three repeats.

Photoluminescent Lifetime

MCS is a photon counting technique for the determination of phosphorescent lifetimes over 10 ns. This makes MCS ideal for measuring the lived NIR emission from quantum dots. To measure the PL lifetime of the PbS dots an HPL-670 pulsed diode laser was used for excitation, and the PL decay collected at 1140 nm using MCS single photon counting (Figure 5). The decay curve is well-described as a single exponential decay with a lifetime of 1.5 µs.

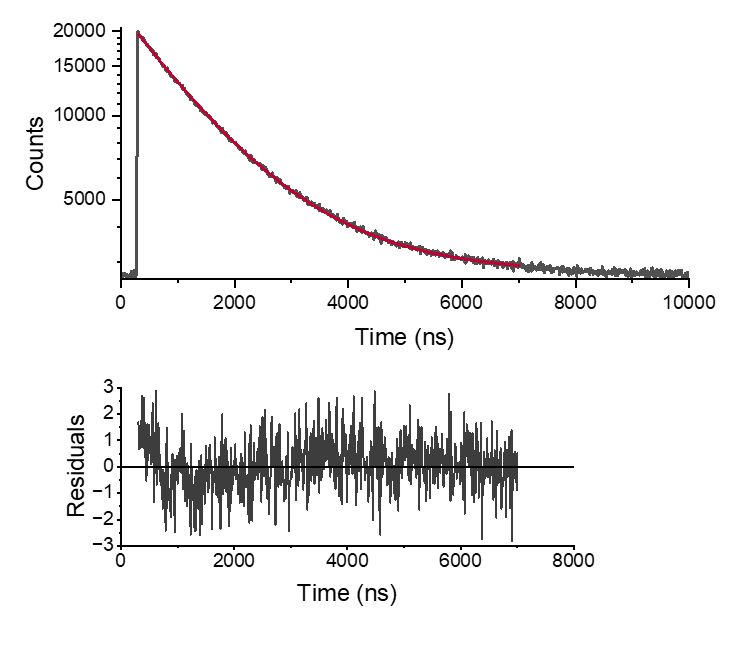
Figure 5. Photoluminescence decay (1140 nm) of the PbS quantum dots acquired using MCS single photon counting with an HPL-670 for excitation at a 100 kHz repetition rate, 10 µs pulse period.  Least squares tail fitting with one component is shown in red with a χ2 of 1.15 and the residuals are shown in the lower panel.

Conclusion

The FLS1000 Photoluminescence Spectrometer was successfully used to evaluate the steady state and time-resolved luminescence properties of a sample of NIR emitting PbS quantum dots. The integrating sphere accessory for the FLS1000 was used to calculate the absolute quantum yield to be 49.9%. Multi-channel scaling was used to measure the long-lived PL lifetime of 1.5 µs using an HPL-670 for excitation.


References

  1. Yang, H. Liu, Y. Huang, L. Li, X. Zhu and Y. Ding, One-step hydrothermal synthesis of near-infrared emission carbon quantum dots as fluorescence aptamer sensor for cortisol sensing and imaging, Talanta, 2023, 260, 1–8.
  2. Ren, Y. Liu, R. Zhang, Y. Zheng, T. Zhao, J. Han, C. Chen and E. Duan, Near-infrared carbon quantum dots from PEG-based deep eutectic solvents for high-accuracy quantitative analysis of naphthenic acids in wastewater, J Environ Chem Eng, 2023, 11, 1–10.
  3. Y. Huang, J. H. Chen, F. Nan, Y. Lin and L. Zhou, Enhancement of near ultraviolet spectral range responsibility of silicon photodetectors via additional fluorescent InP/ZnS quantum dots layer, Opt Laser Technol, 2023, 166, 1–7.
  4. Asha Krishnan, K. Yadav, P. Roach and V. Chelvam, A targeted near-infrared nanoprobe for deep-tissue penetration and imaging of prostate cancer, Biomater Sci, 2021, 9, 2295–2312.
  5. Imamura, S. Yamada, S. Tsuboi, Y. Nakane, Y. Tsukasaki, A. Komatsuzaki and T. Jin, Near-infrared emitting PbS quantum dots for in vivo fluorescence imaging of the thrombotic state in septic mouse brain, Molecules, 2016, 21, 1–12.
  6. Gulati, M. Sachdeva and K. K. Bhasin, in AIP Conference Proceedings, AIP, 2018, p. 030214.

RELATED PRODUCTS

FLS1000

Photoluminescence Spectrometer

VIEW

FS5

Spectrofluorometer

VIEW

Contact our expert team today to find out more about how our products can improve your research

Contact Us
PrevPrevious
NextNext
Previous Substrates for Raman Microscopy Next Raman Imaging of Strain in a Silicon Semiconductor Wafer

RESOURCES

Tags:
  • Application Notes
  • Quantum Dots
  • FLS1000
  • Photoluminescence
Download PDF
Suggested Reading:

NIR Emission Spectra of PbS Quantum Dots Using the FS5 Spectrofluorometer

View more »

Near Infrared PMT Options for the FLS1000 Photoluminescence Spectrometer

View more »
Share:

Keep up to date with the latest from Edinburgh Instruments

Join our mailing list and keep up with our latest videos, app notes and more!

LOCATION:
  • Edinburgh Instruments Ltd.
    2 Bain Square, Kirkton Campus, Livingston, EH54 7DQ.
  • sales@edinst.com
  • +44 1506 425 300
ABOUT:
  • About Us
  • Techniques
  • Applications
  • Knowledgebase
  • About Us
  • Techniques
  • Applications
  • Knowledgebase
PRODUCTS:
  • Fluorescence Spectrometers
  • Raman Microscopes
  • UV-Vis Spectrophotometers
  • Transient Absorption
  • FTIR Spectrometers
  • Lasers and LEDs
  • Customisation Options
  • Software
  • Upgrades
  • All Products
  • Fluorescence Spectrometers
  • Raman Microscopes
  • UV-Vis Spectrophotometers
  • Transient Absorption
  • FTIR Spectrometers
  • Lasers and LEDs
  • Customisation Options
  • Software
  • Upgrades
  • All Products
LEGALS:
  • News
  • Events
  • Blog
  • Careers
  • Contact Us
  • Terms and Conditions
  • Privacy Policy
  • News
  • Events
  • Blog
  • Careers
  • Contact Us
  • Terms and Conditions
  • Privacy Policy
SOCIALS:
Youtube Linkedin X-twitter Facebook
©2024 Edinburgh Instruments. Registered in England and Wales No: 962331. VAT No: GB 271 7379 37
Manage Consent
To provide the best experiences, we use technologies like cookies to store and/or access device information. Consenting to these technologies will allow us to process data such as browsing behaviour or unique IDs on this site. Not consenting or withdrawing consent, may adversely affect certain features and functions.
Functional Always active
The technical storage or access is strictly necessary for the legitimate purpose of enabling the use of a specific service explicitly requested by the subscriber or user, or for the sole purpose of carrying out the transmission of a communication over an electronic communications network.
Preferences
The technical storage or access is necessary for the legitimate purpose of storing preferences that are not requested by the subscriber or user.
Statistics
The technical storage or access that is used exclusively for statistical purposes. The technical storage or access that is used exclusively for anonymous statistical purposes. Without a subpoena, voluntary compliance on the part of your Internet Service Provider, or additional records from a third party, information stored or retrieved for this purpose alone cannot usually be used to identify you.
Marketing
The technical storage or access is required to create user profiles to send advertising, or to track the user on a website or across several websites for similar marketing purposes.
Manage options Manage services Manage {vendor_count} vendors Read more about these purposes
View preferences
{title} {title} {title}