Skip to content
Skip to content
  • News
  • Events
  • eBooks
  • Blog
  • Careers
  • Contact
  • News
  • Events
  • eBooks
  • Blog
  • Careers
  • Contact
KNOWLEDGEBASE
  • About Us
  • Products

    Fluorescence Spectrometers

    • FLS1000 Photoluminescence Spectrometer
    • FS5 Spectrofluorometer
    • LifeSpec II Lifetime Spectrometer
    • Mini-tau Lifetime Spectrometer

    Raman Microscopes

    • RM5 Raman Microscope
    • RMS1000 Multimodal Confocal Microscope

    Transient Absorption

    • LP980 Transient Absorption Spectrometer

    FTIR Spectrometers

    • IR5 FTIR Spectrometer

    Lasers and LEDs

    • Pulsed Lasers
    • Gas Lasers
    • Customisation Options
    View All Products
  • Techniques
  • Applications
KNOWLEDGEBASE
Edit Content
  • About Us
  • Products
  • Techniques
  • Applications
  • Knowledgebase
  • eBooks
  • News
  • Events
  • Blog
  • Careers
  • Contact Us

RESOURCES

Batch and Global Analysis of Fluorescence Lifetimes

  • August 25, 2023

KEY POINTS

  • Large datasets of fluorescence lifetimes can be processed in Edinburgh Instruments’ FAST software.
  • Fluorescence lifetime datasets of a three-fluorophore mixture (erythrosin b, fluorescein, and 9-aminoacridine) were processed in FAST using Batch Processing and Global Analysis, providing valuable insights into the sample’s lifetime components and their relative weight distribution.
  • In Batch Analysis, the fluorescence lifetimes of the mixture were automatically processed in a single batch, and the decays were analysed independently.
  • In Global Analysis, the fluorescence lifetimes of the mixture were linked, and the same global lifetime component was used to fit all the decays in the dataset.
Edit Content

Analysing large fluorescence lifetime datasets requires automated processing and the identification of common patterns across the dataset. Batch Analysis and Global Analysis are two automated processing methods for fluorescence lifetime datasets that are available in Edinburgh Instruments FAST lifetime analysis software. In this Application Note, fluorescence lifetimes and relative weights of a three-fluorophore mixture of erythrosin b, fluorescein, and 9-aminoacridine (9AA) were analysed using both batch and global analysis in FAST, and the processing methods compared.

Methods and Experimental Setup

The fluorescence lifetimes were acquired using an Edinburgh Instruments FLS1000 Photoluminescence Spectrometer equipped with a PR2 Microwell Plate Reader and a High-Speed Hybrid Photodetector (HS-HPD). An EPL-445 picosecond pulsed diode laser was used as the excitation source and operated at 10 MHz, and the lifetimes were acquired using TCSPC. Each fluorophore was diluted in methanol to give an absorbance of around 0.03 for erythrosin b, 0.06 for fluorescein, and 0.09 for 9AA at the EPL’s operational wavelength, 437 nm. Three wells were filled with ~150 μl of each pure fluorophore, and ten wells were filled with ~150 μl of the three-fluorophore mixture. Representative figures of the plate reader and the plate reader interface in Fluoracle® that shows the ten selected wells containing the mixture can be seen in Figures 1a and 1b, respectively.

Edinburgh Instruments FLS1000 plate reader and plate reader interface in Fluoracle

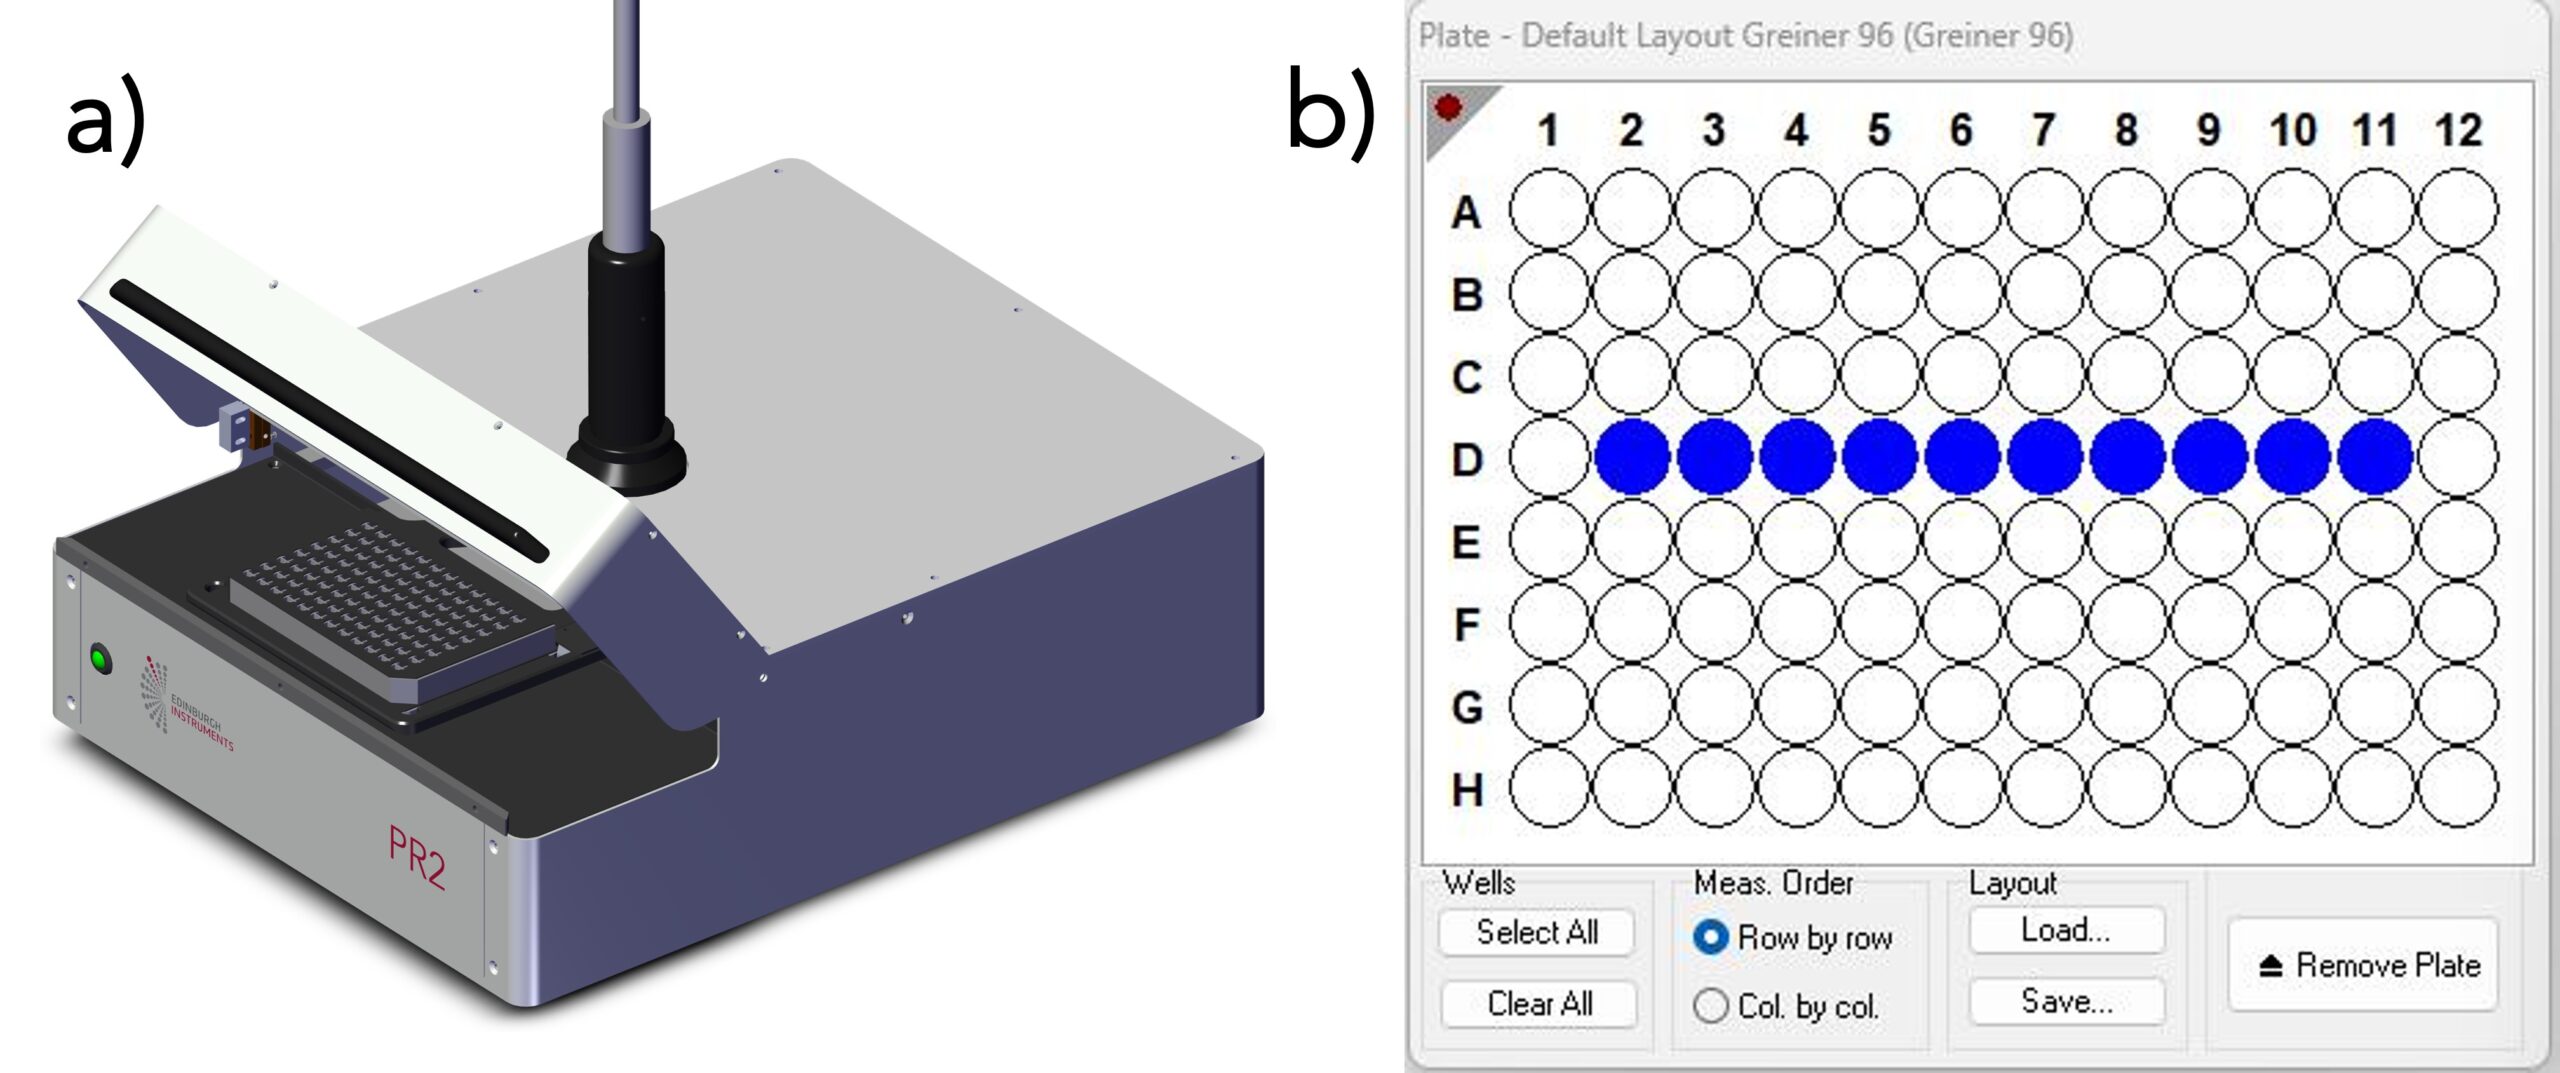
Figure 1. a) The FLS1000 plate reader (PR2), and b) PR2 Plate Reader interface in Fluoracle

Lifetime Analysis of the Individual Decays

The fluorescence lifetimes of the three pure fluorophores can be seen in Figure 2. Erythrosin b (Figure 2a) exhibits the shortest decay (0.46 ns), and therefore, the fit was a deconvolution of the instrument response function (IRF) and the exponential decay of the sample. The IRF was not considered for Fluorescein and 9AA as they were characterised by longer lifetimes. Figures 2b and 2c show the Fluorescein (4.41 ns) and 9AA’s (12.41 ns) decays, fitted by a single exponential decay.

Analysis of Erythrosin and other compounds

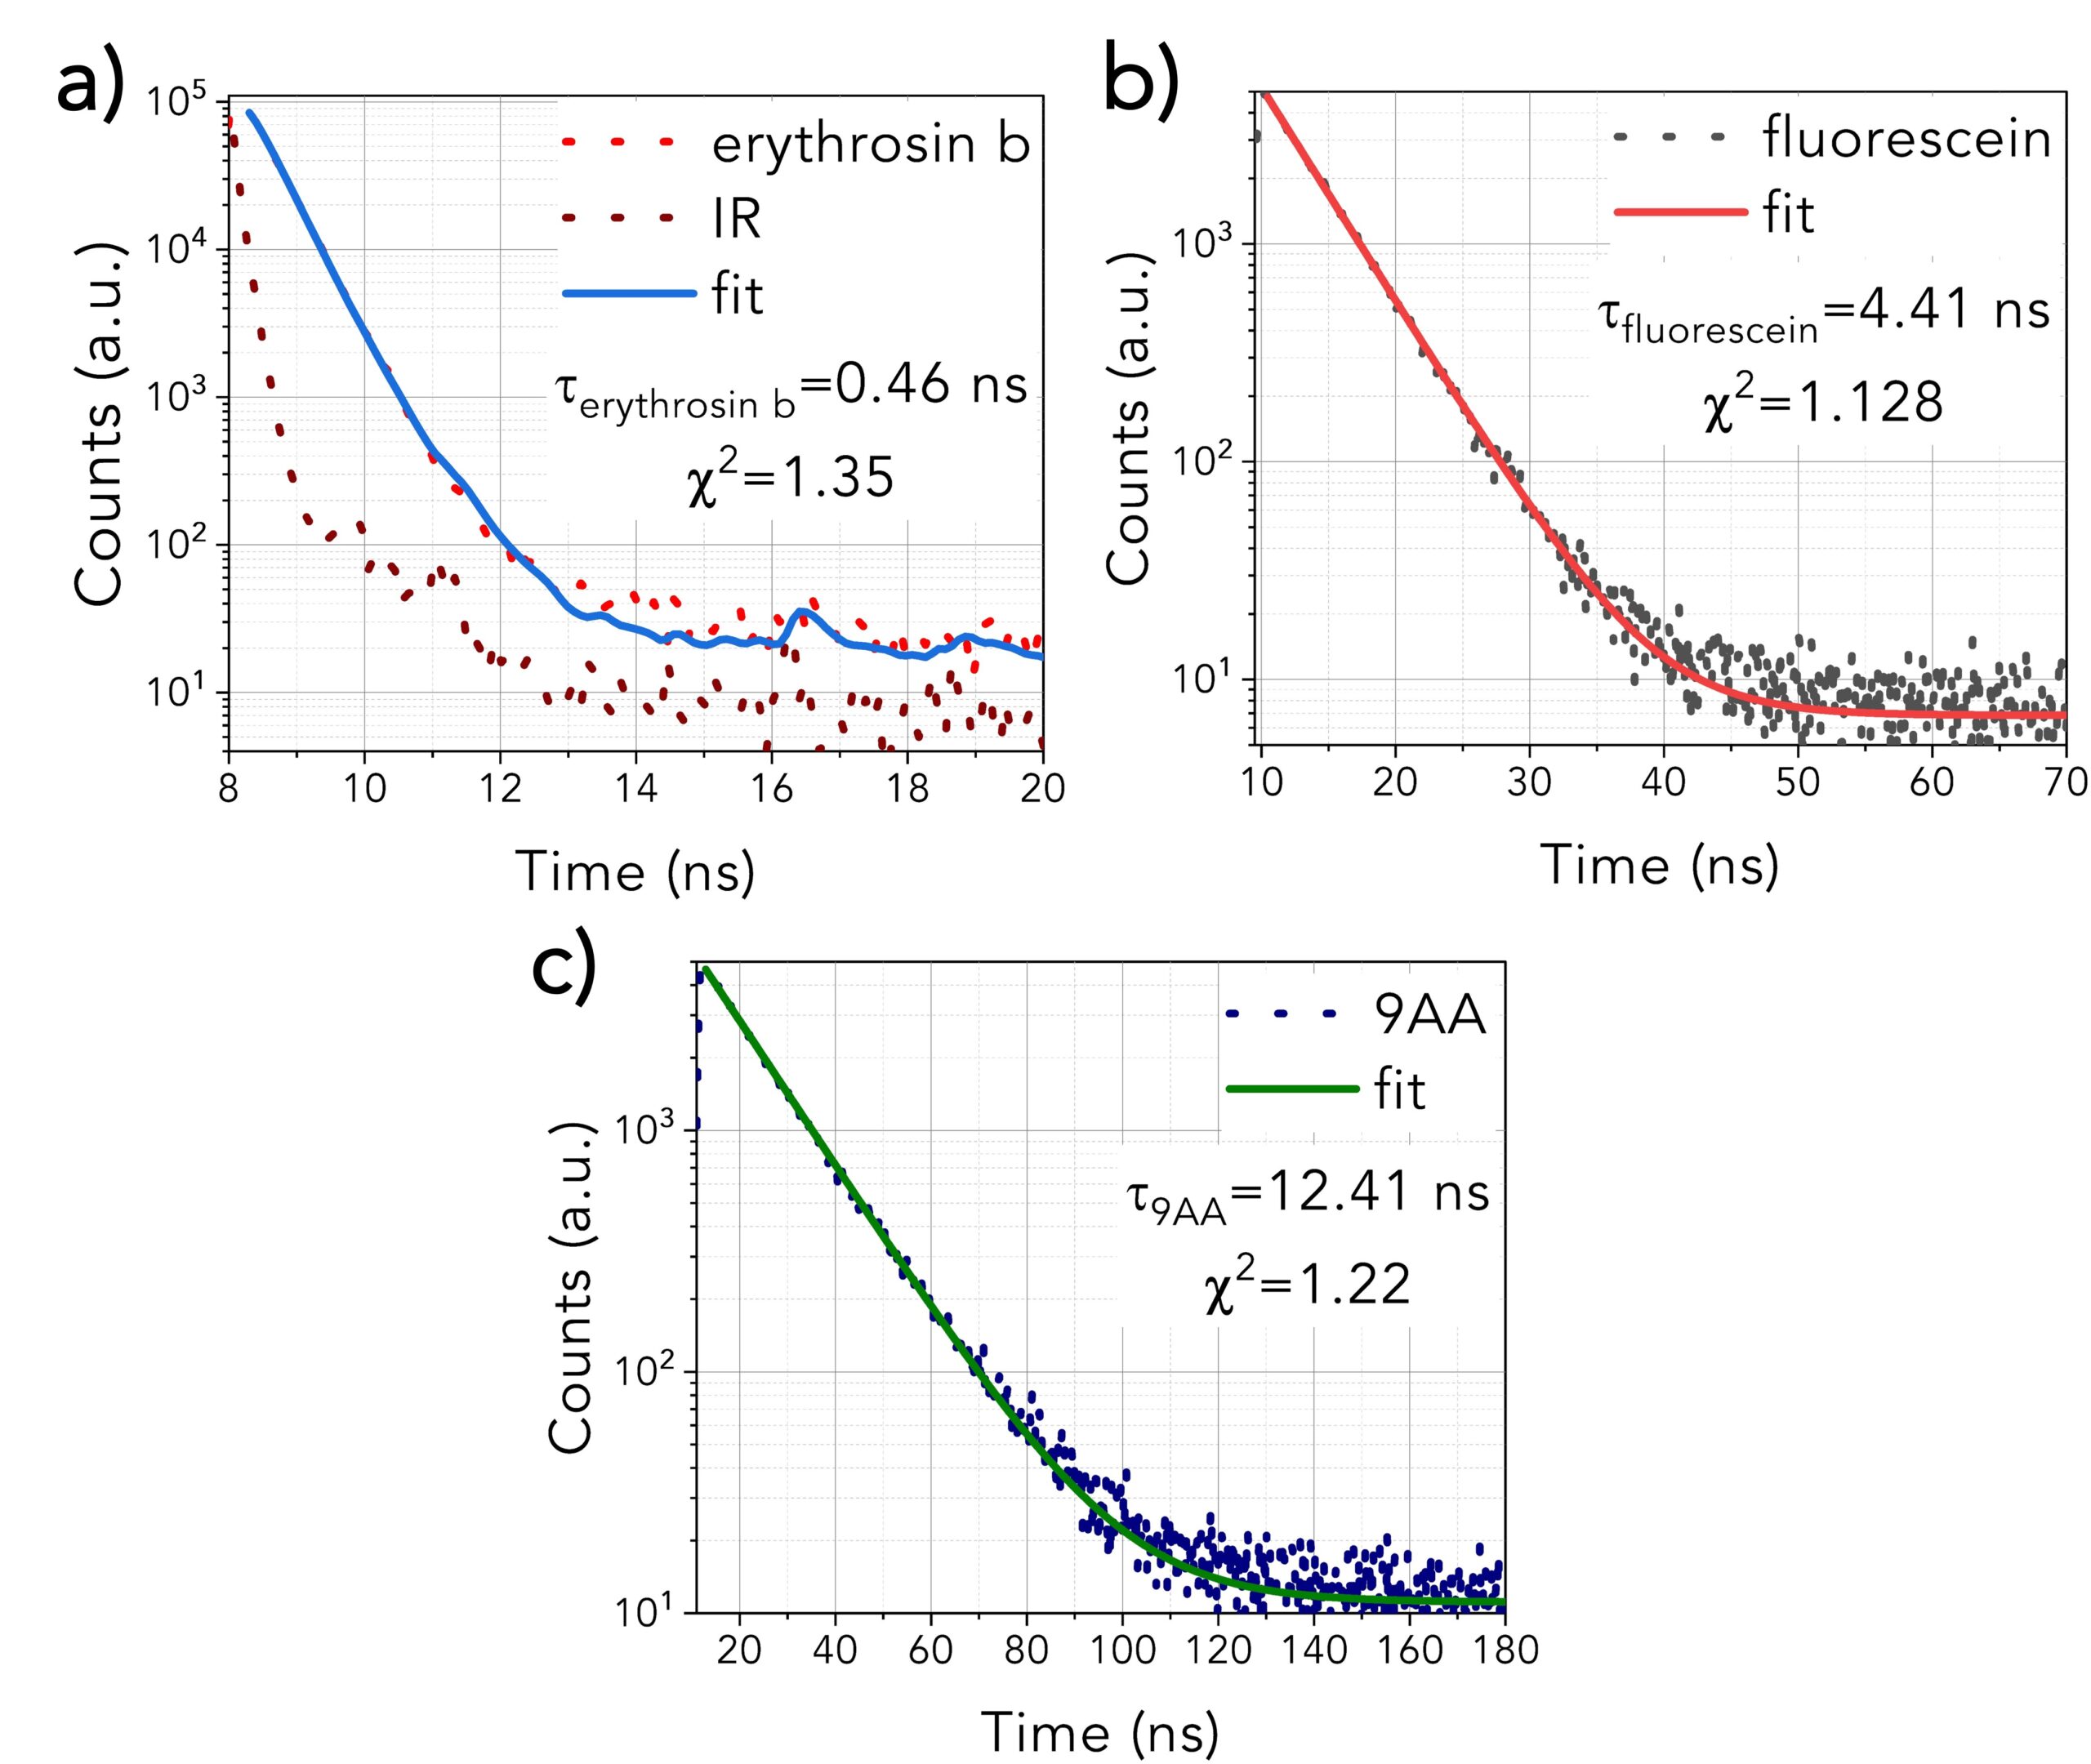
Figure 2. Fluorescence lifetimes of a) erythrosin b, b) fluorescein, c) 9AA

Batch Analysis of the Mixture

The ten fluorescence decays of the mixture were first analysed using batch analysis. In batch analysis multiple decays can be automatically analysed in a single batch. The decays are analysed independently and fitted to a chosen model to obtain independent information for each decay. The ten decays of the mixture were imported into FAST, and batch analysed using the Exponential Components Analysis routine. A three-component exponential model was chosen since the mixture comprises three fluorophores (Figure 3). In the case of an unknown sample, the user could start fitting with a single exponential component and then add additional components if required after reviewing the residuals and chi-squared optimisation.

Batch processing Parameters

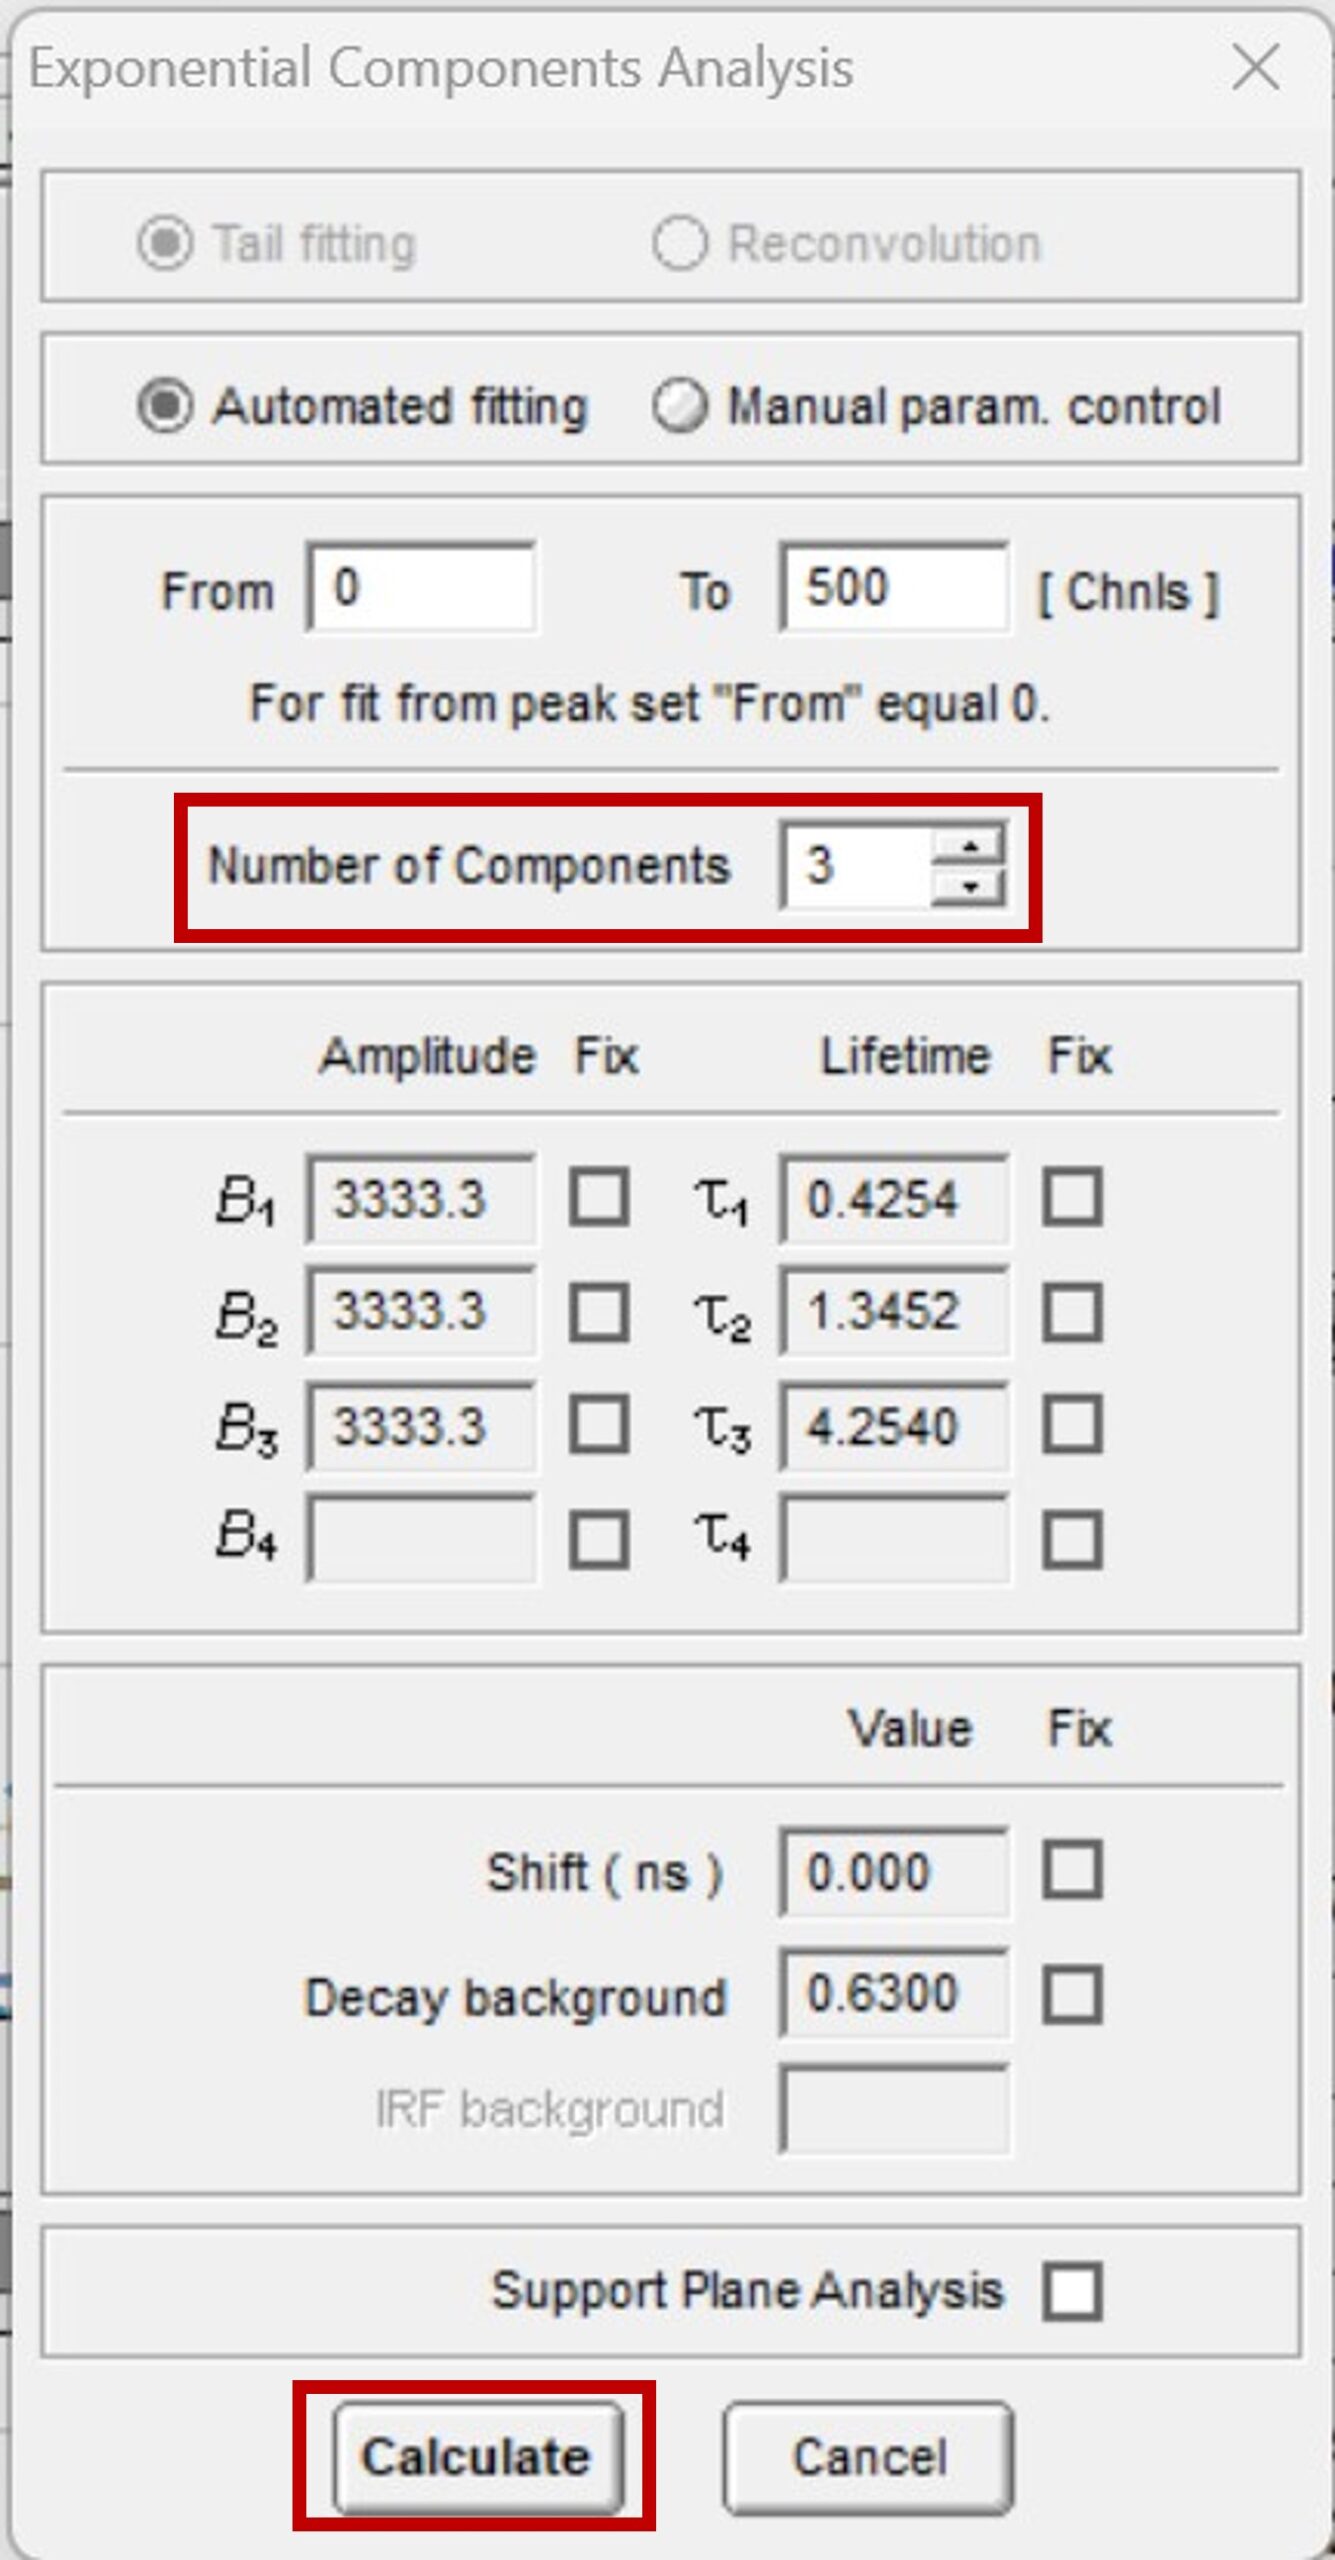
Figure 3. Parameters for batch processing in FAST

FAST then performs fitting for each fluorescence decay providing numerical information about τ1, τ2, and τ3, their amplitudes, Bi, (with amplitude standard deviation, ΔBi) and weights, fi (%) (with weights standard deviations, Δfi %). The distributions of the relative weights, fi (%), of each exponential component are plotted in Figure 4 alongside the average lifetime of each component. The average lifetimes of the τ1, τ2 and τ3 components closely match those of pure erythrosin B, fluorescein and 9AA, respectively.

Lifetimes distribution and relative weights of the tree components using batch processing

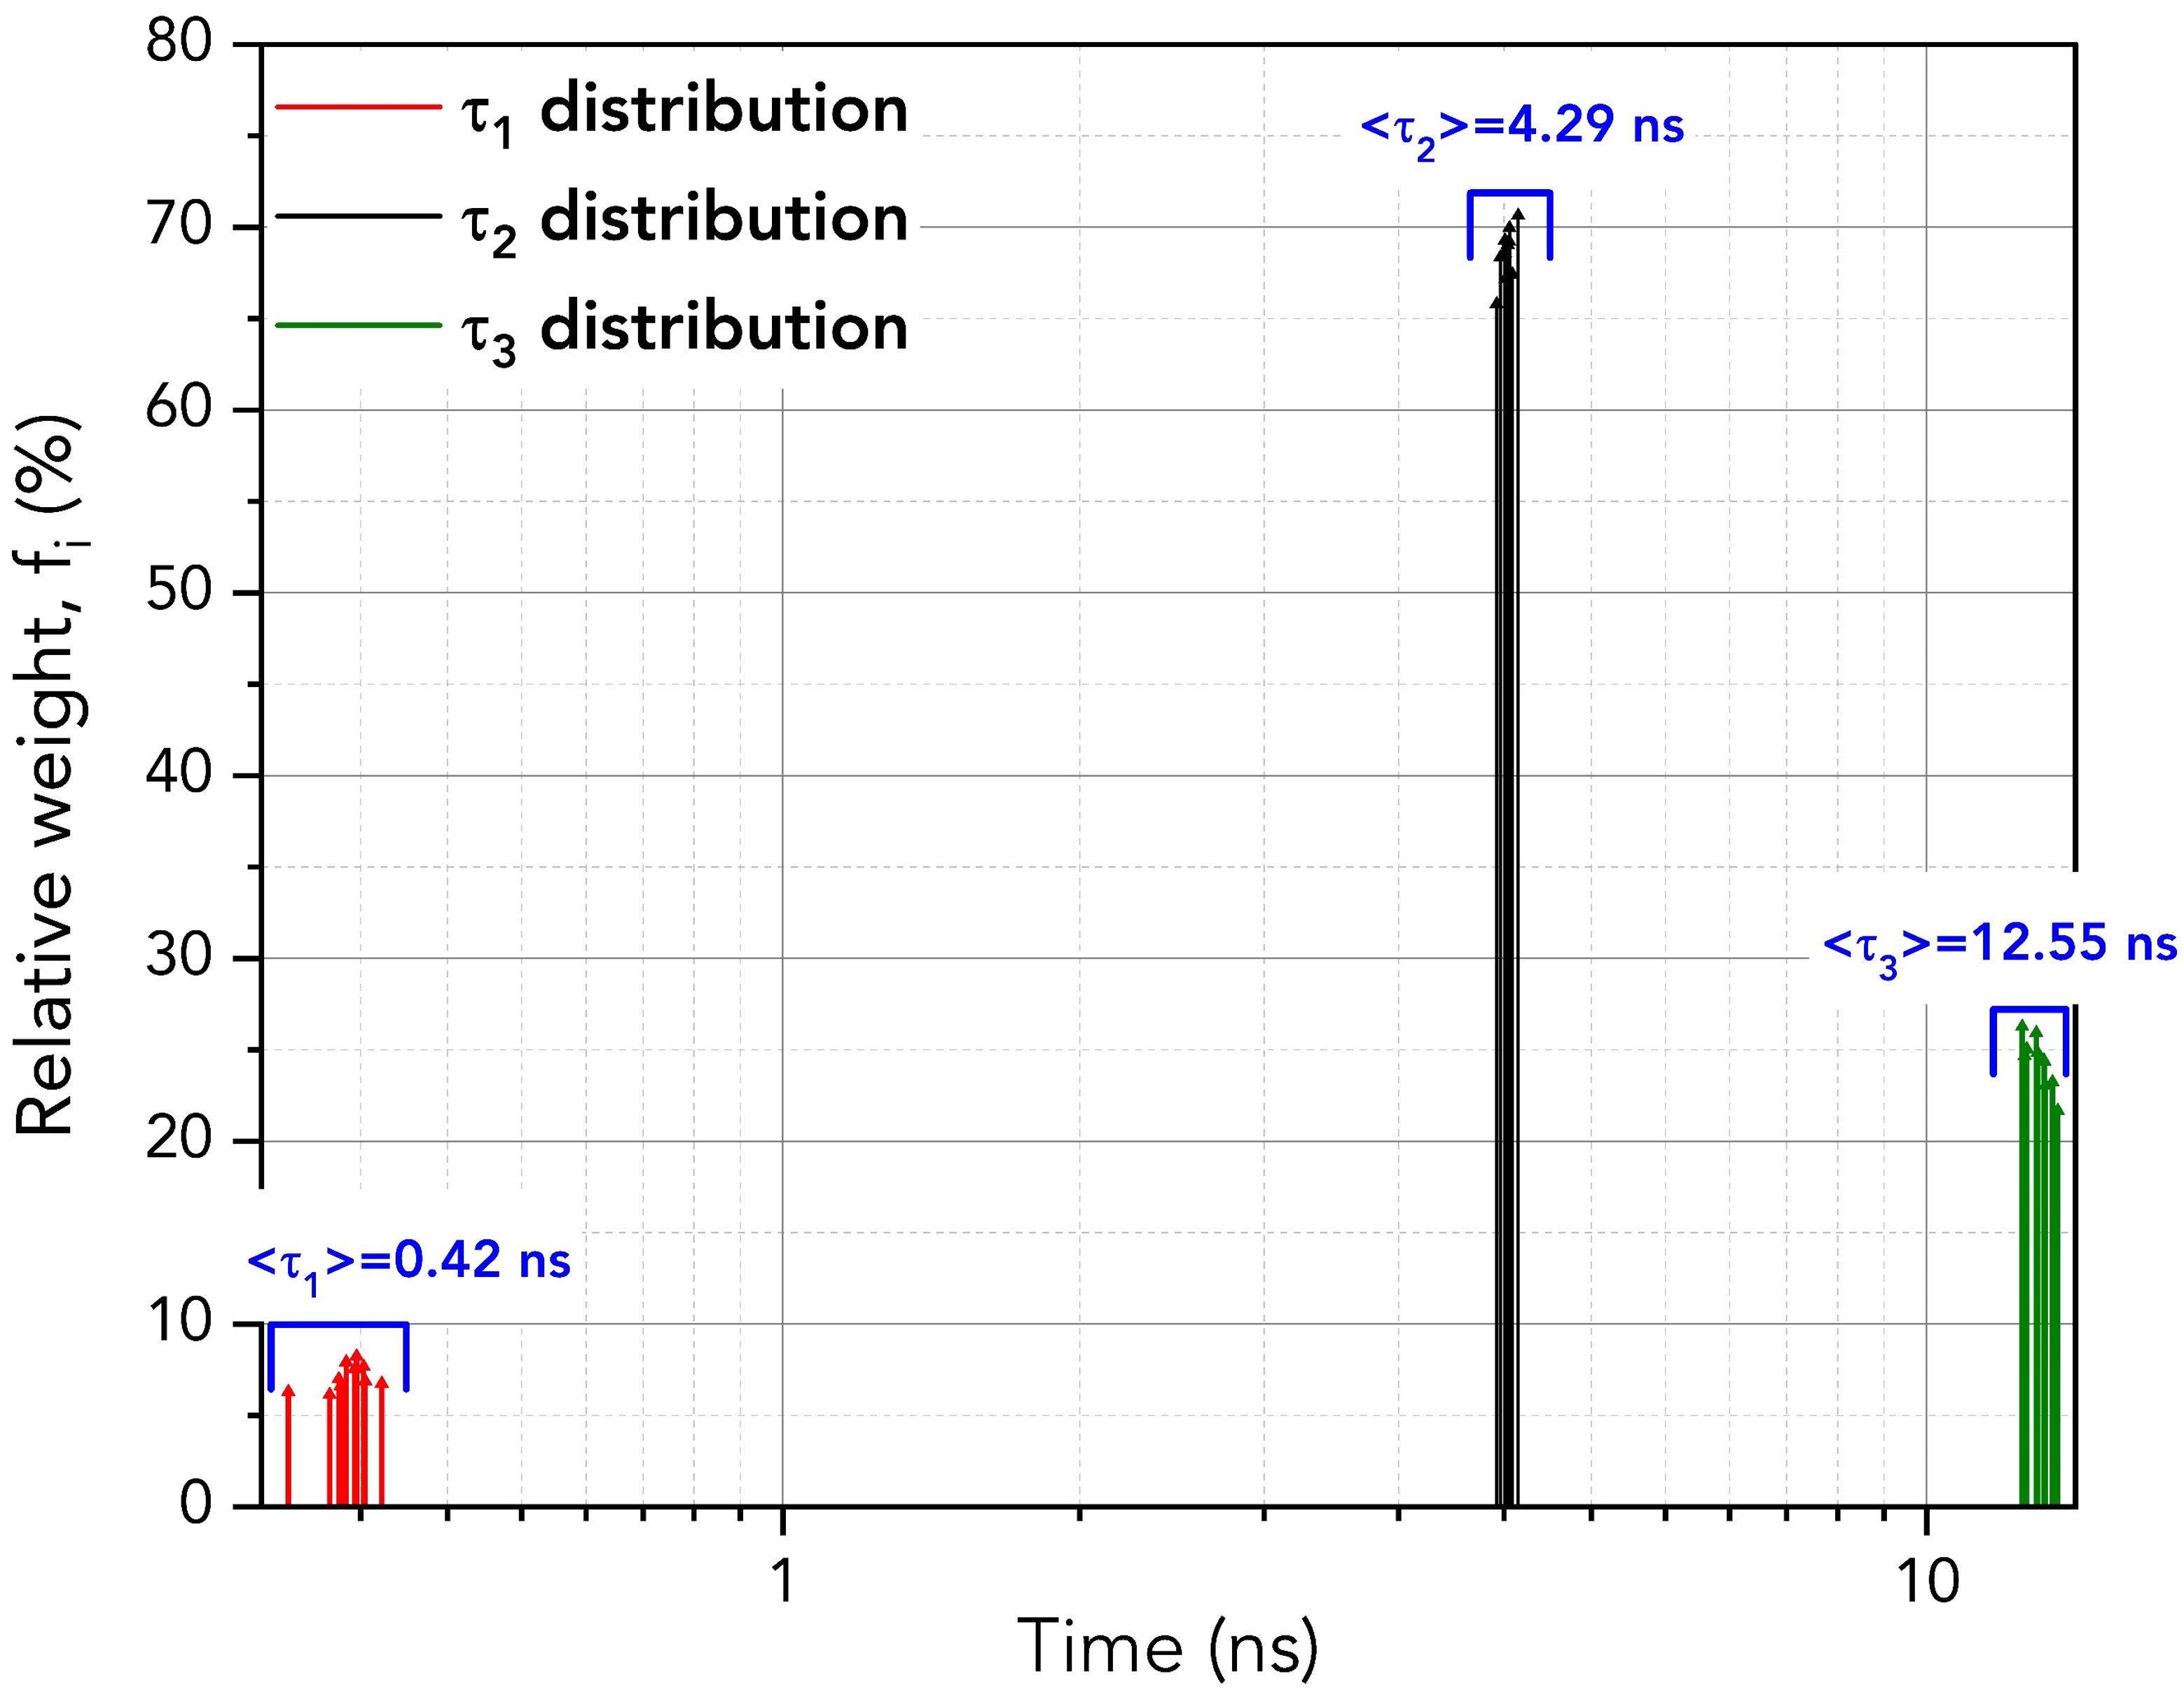
Figure 4. Distribution of the lifetimes and relative weights of the three components across the ten decays using batch analysis

Global Analysis of the Mixture

In global analysis, the component lifetimes are no longer independent across the multiple decays in the dataset; they are a global parameter. Global analysis assumes that a global component lifetime can describe all the fluorescence decays in a dataset.

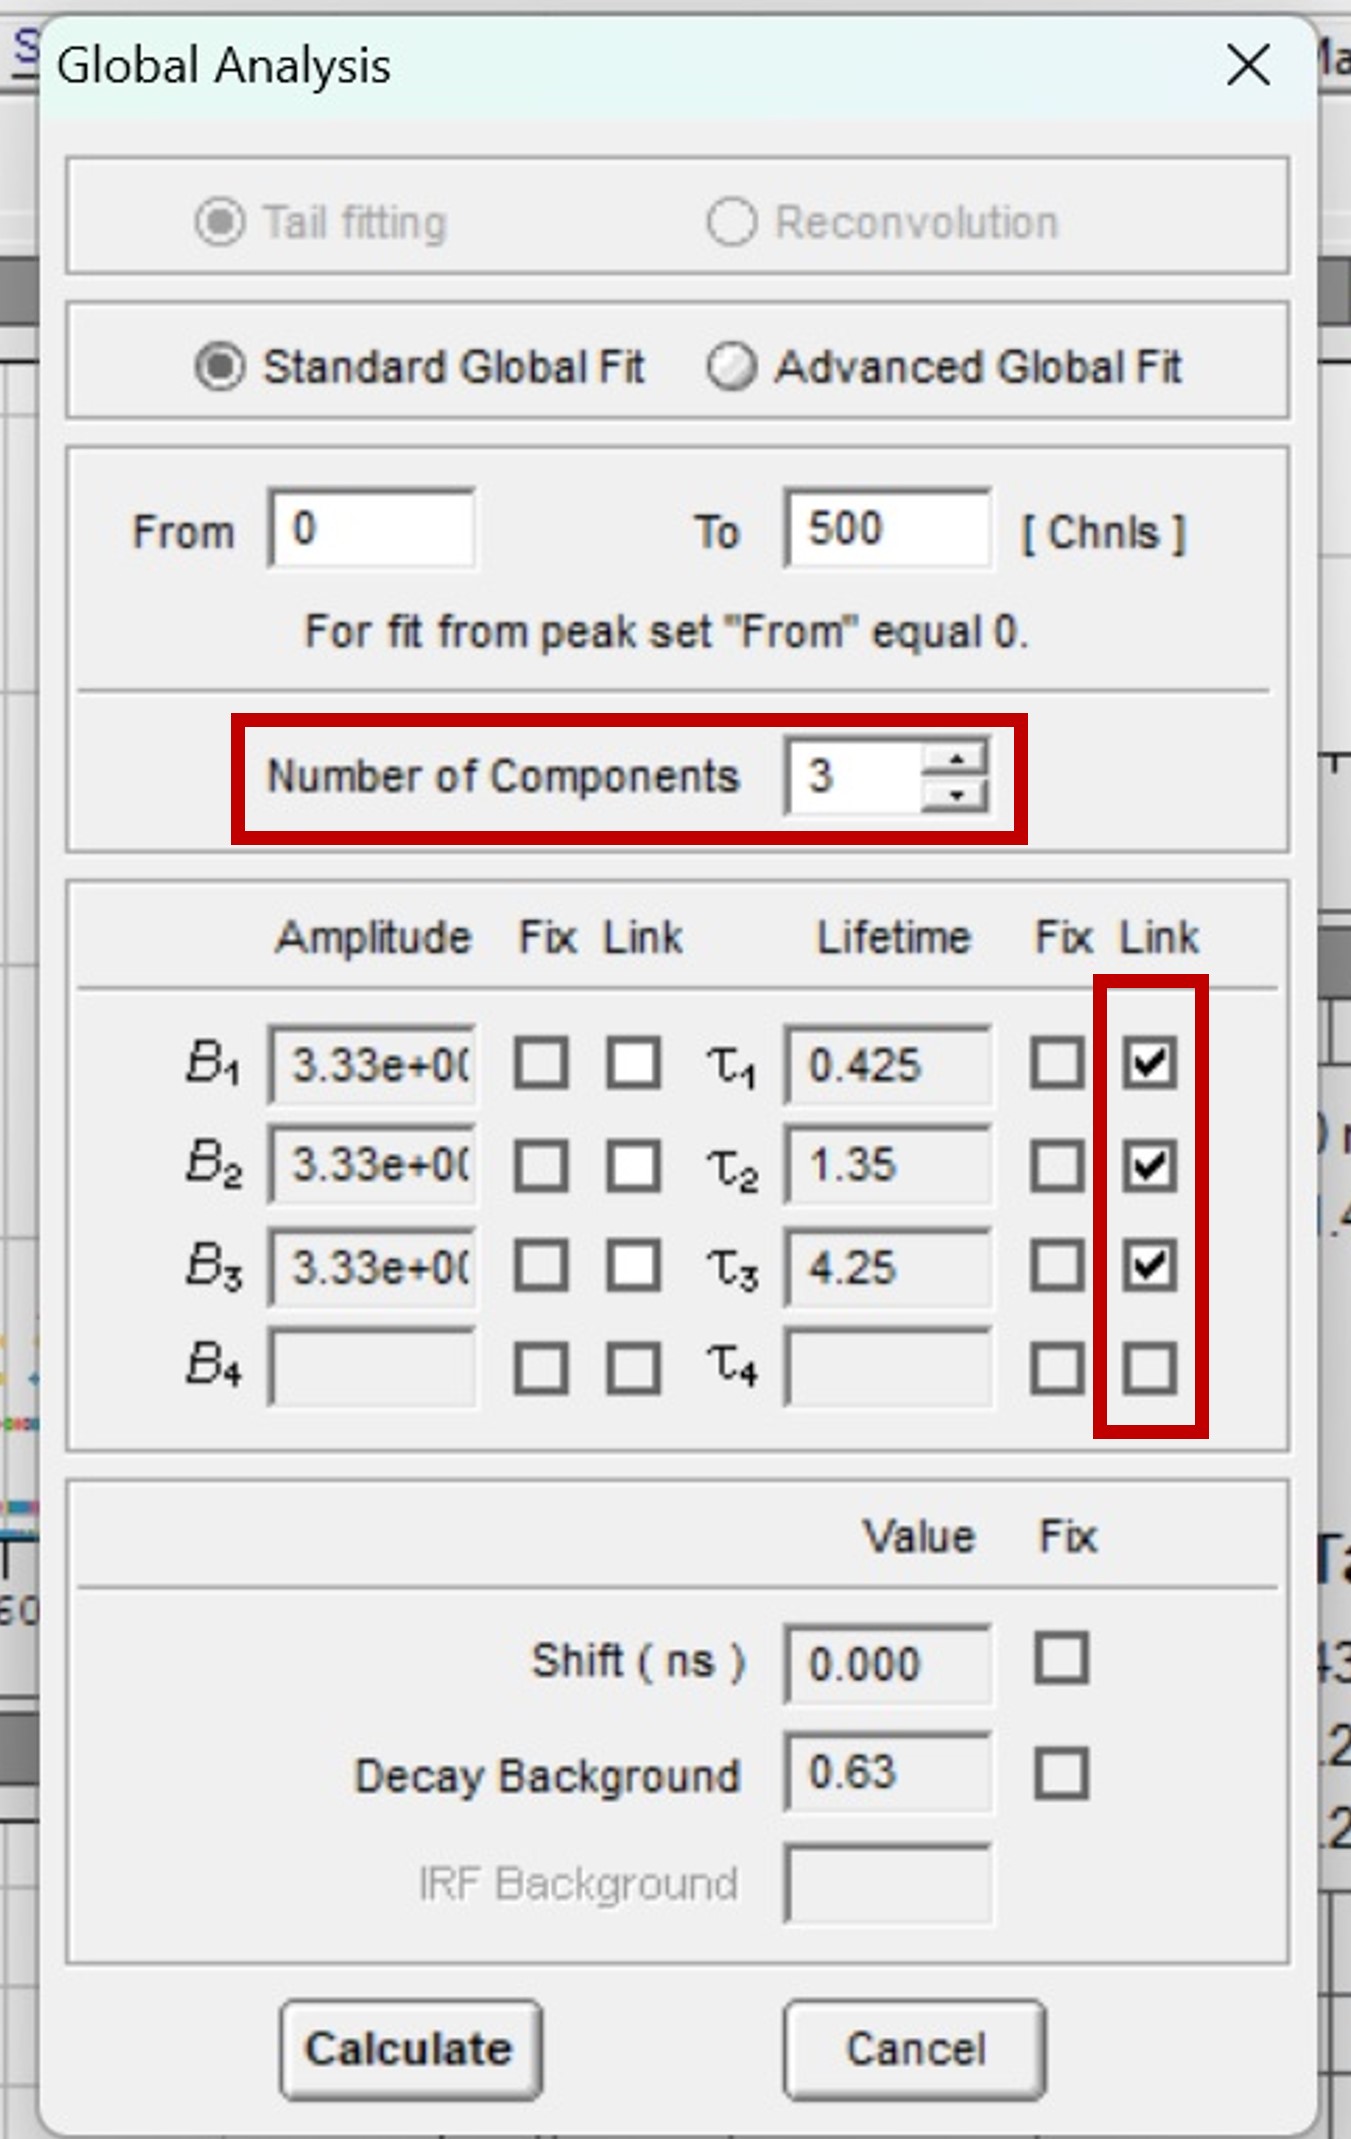
Figure 5. Parameters for global analysis in FAST

Figure 5 shows how to set the parameters in FAST to perform global analysis. τ1, τ2 and τ3 are set to be linked. Linking a lifetime component means that the same component lifetime is a global parameter and is used to fit all decays in the dataset. The component’s lifetime is then optimised across all decays in the dataset during the fitting routine to find the lifetime that best describes all decays collectively. The lifetimes and relative weight of the global analysis results are shown graphically in Figure 6. Since the lifetimes are now a global parameter, there is no longer a distribution for each lifetime component. Instead, there is a single lifetime value for each component that best describes all ten decays.


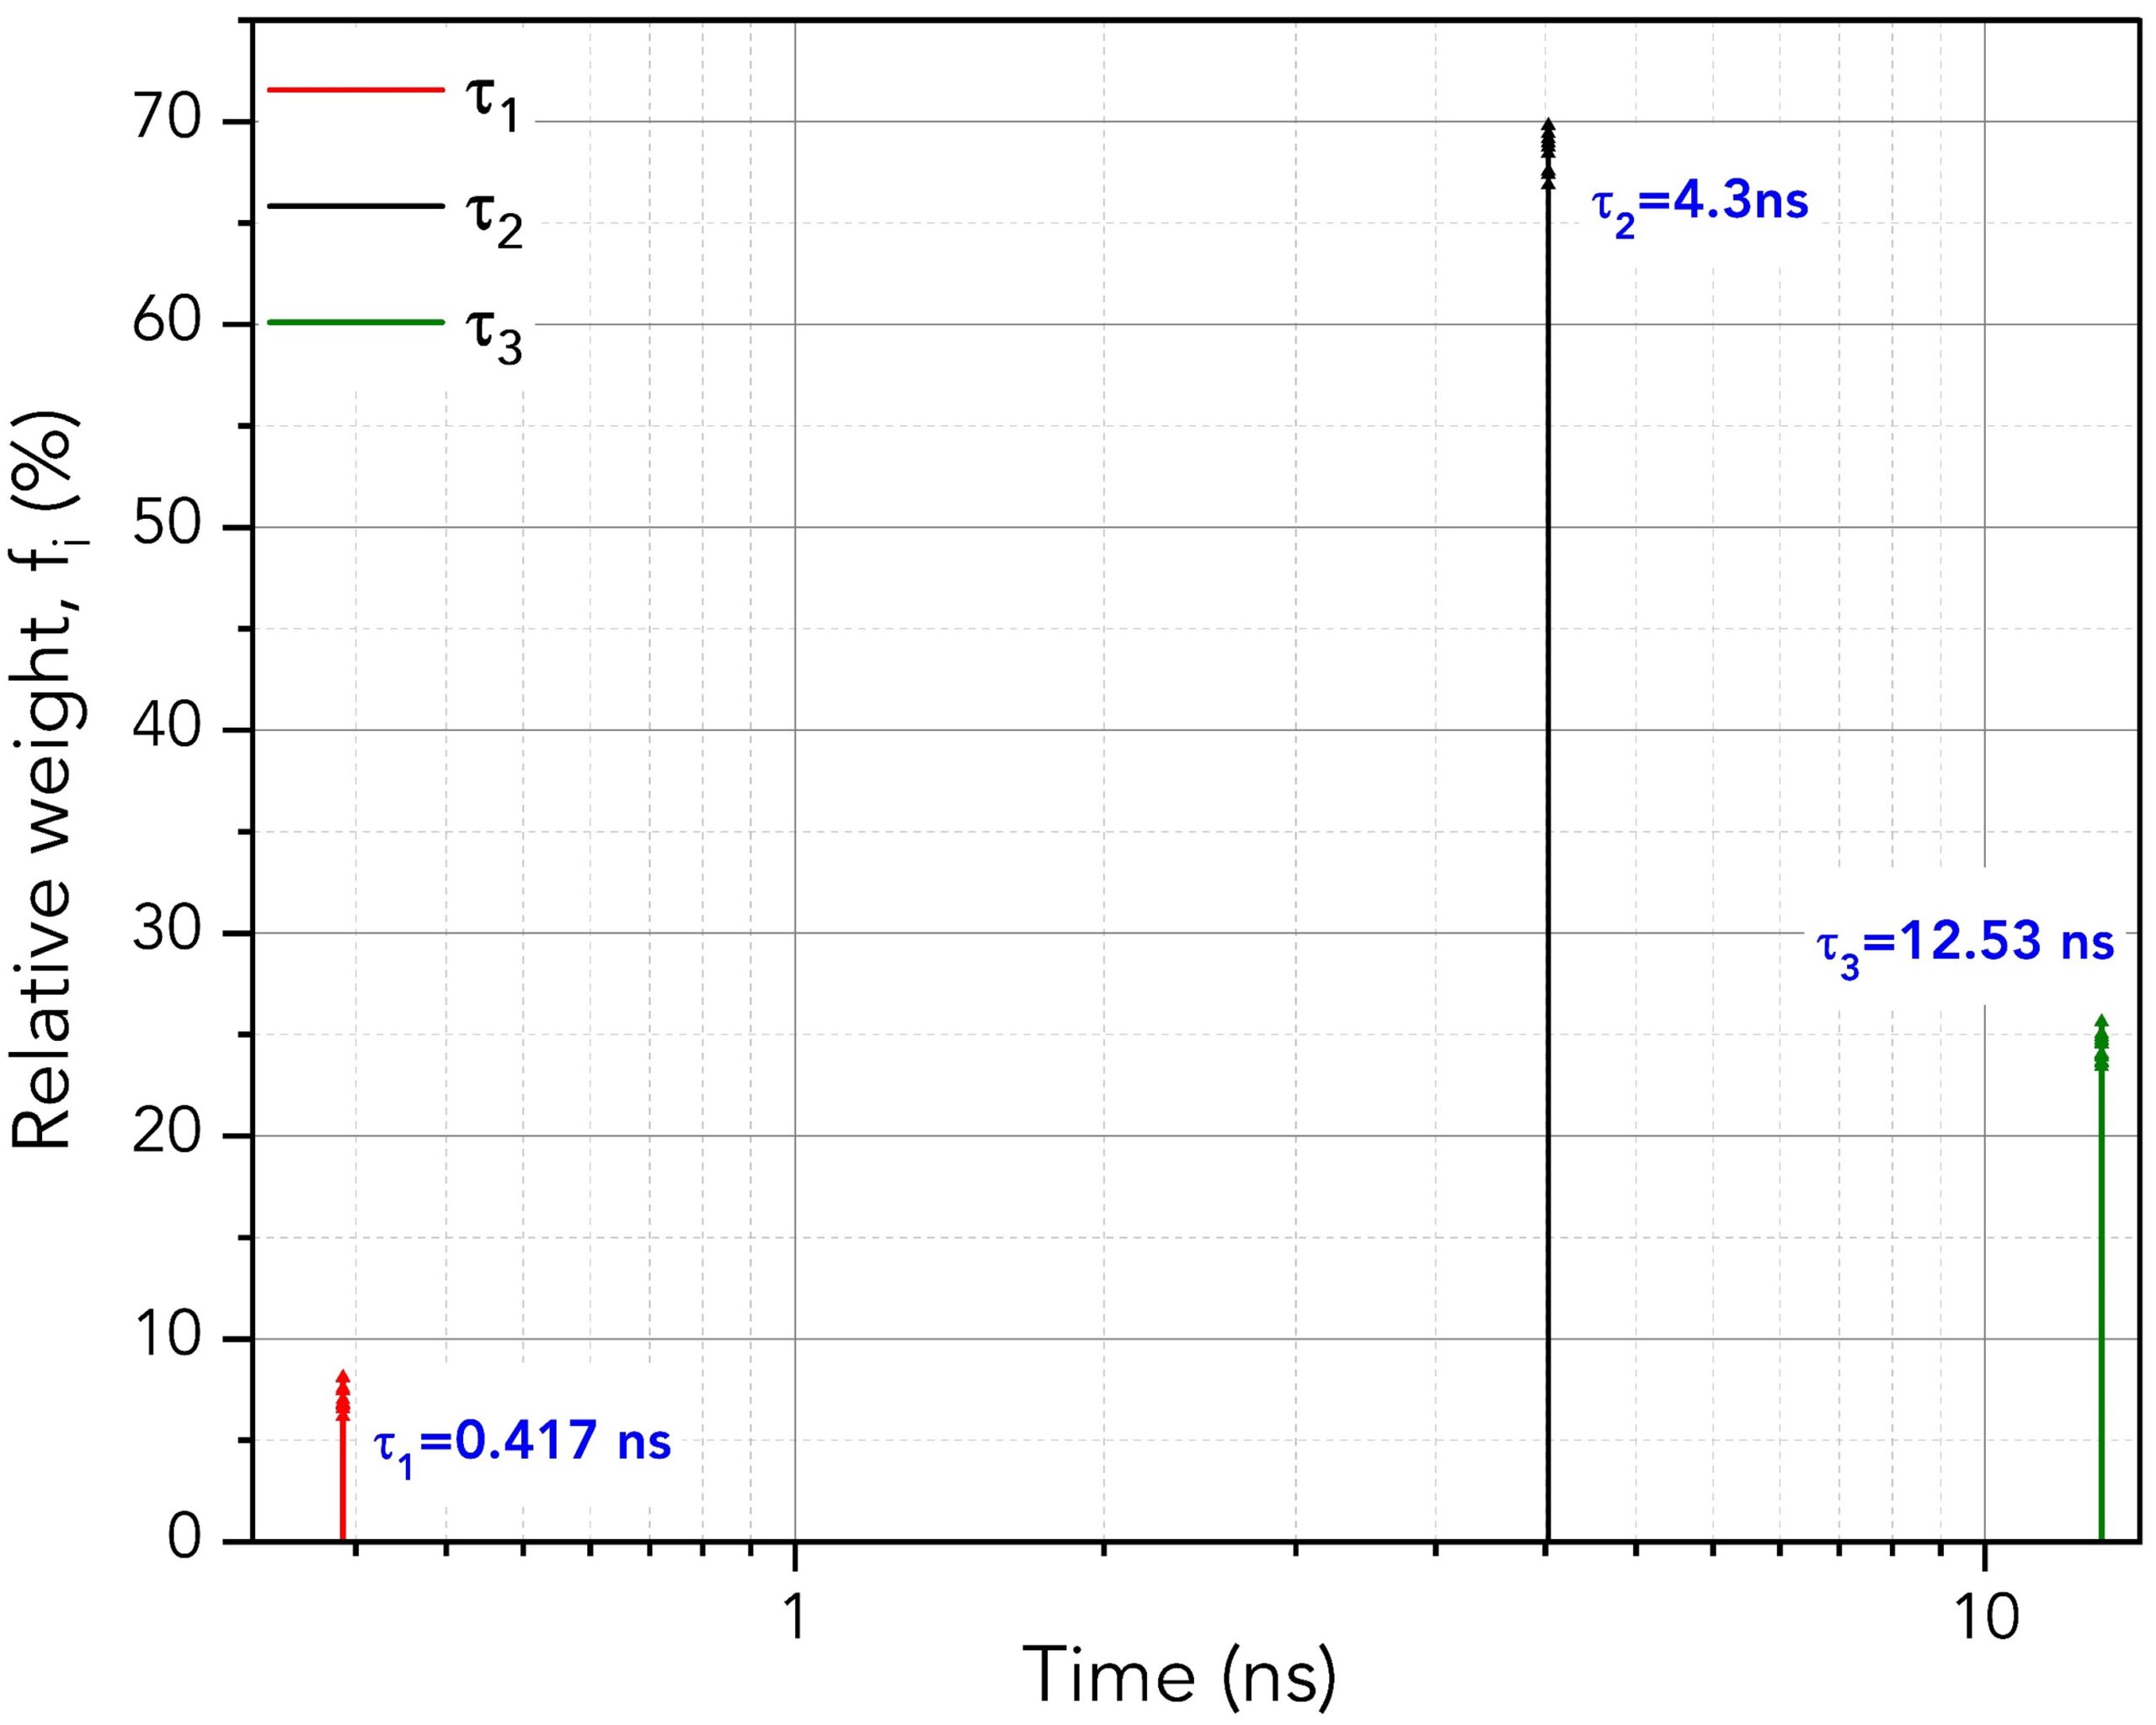
Figure 6. Lifetimes and relative weights of the three components using global analysis across the ten decays

It is worth mentioning that if τ1, τ2, and τ3 were all set to unlinked, then the results would precisely match the batch processing analysis of the previous section. Thus, the user can perform both techniques promptly by linking and unlinking the time variables.

Conclusion

This Application Note outlined the successful application of Edinburgh Instruments’ FAST software for batch analysis and global analysis in studying the lifetimes of a three-fluorophore mixture. The batch analysis approach treats the lifetimes of each component in the mixture as independent parameters, while the global analysis approach considers them as linked (global parameters). Both methods offer valuable insights into the lifetimes and relative weight distribution of the individual components within a multi-fluorophore mixture. The choice between these methods should be based on the specific samples being studied and their intended applications.

RELATED PRODUCTS

FLS1000

Photoluminescence Spectrometer

VIEW

FAST

Advanced Fluorescence Lifetime Analysis Software

VIEW

Fluoracle®

Photoluminescence Control and Analysis Software

VIEW

Contact our expert team today to find out more about how our products can improve your research

Contact Us
PrevPrevious
NextNext
Previous Detection of Singlet Oxygen by Photoluminescence Spectroscopy Next Infrared or Raman Spectroscopy?

RESOURCES

Tags:
  • Application Notes
  • Photophysics
  • FLS1000
  • FS5
  • Photoluminescence
Download PDF
Suggested Reading:

High-Speed Hybrid Photodetector (HS-HPD)

View more »

Measuring Picosecond Fluorescence Lifetimes Using the FLS1000 Equipped with a Hybrid Photodetector

View more »
Share:

Keep up to date with the latest from Edinburgh Instruments

Join our mailing list and keep up with our latest videos, app notes and more!

LOCATION:
  • Edinburgh Instruments Ltd.
    2 Bain Square, Kirkton Campus, Livingston, EH54 7DQ.
  • sales@edinst.com
  • +44 1506 425 300
ABOUT:
  • About Us
  • Techniques
  • Applications
  • Knowledgebase
  • About Us
  • Techniques
  • Applications
  • Knowledgebase
PRODUCTS:
  • Fluorescence Spectrometers
  • Raman Microscopes
  • UV-Vis Spectrophotometers
  • Transient Absorption
  • FTIR Spectrometers
  • Lasers and LEDs
  • Customisation Options
  • Software
  • Upgrades
  • All Products
  • Fluorescence Spectrometers
  • Raman Microscopes
  • UV-Vis Spectrophotometers
  • Transient Absorption
  • FTIR Spectrometers
  • Lasers and LEDs
  • Customisation Options
  • Software
  • Upgrades
  • All Products
LEGALS:
  • News
  • Events
  • Blog
  • Careers
  • Contact Us
  • Terms and Conditions
  • Privacy Policy
  • News
  • Events
  • Blog
  • Careers
  • Contact Us
  • Terms and Conditions
  • Privacy Policy
SOCIALS:
Youtube Linkedin X-twitter Facebook
©2024 Edinburgh Instruments. Registered in England and Wales No: 962331. VAT No: GB 271 7379 37
Manage Consent
To provide the best experiences, we use technologies like cookies to store and/or access device information. Consenting to these technologies will allow us to process data such as browsing behaviour or unique IDs on this site. Not consenting or withdrawing consent, may adversely affect certain features and functions.
Functional Always active
The technical storage or access is strictly necessary for the legitimate purpose of enabling the use of a specific service explicitly requested by the subscriber or user, or for the sole purpose of carrying out the transmission of a communication over an electronic communications network.
Preferences
The technical storage or access is necessary for the legitimate purpose of storing preferences that are not requested by the subscriber or user.
Statistics
The technical storage or access that is used exclusively for statistical purposes. The technical storage or access that is used exclusively for anonymous statistical purposes. Without a subpoena, voluntary compliance on the part of your Internet Service Provider, or additional records from a third party, information stored or retrieved for this purpose alone cannot usually be used to identify you.
Marketing
The technical storage or access is required to create user profiles to send advertising, or to track the user on a website or across several websites for similar marketing purposes.
Manage options Manage services Manage {vendor_count} vendors Read more about these purposes
View preferences
{title} {title} {title}