Welcome to Edinburgh Instruments’ monthly blog celebrating our work in Raman, Photoluminescence, and Fluorescence Lifetime Imaging. Every month we will highlight our pick for Map of the Month to show how our spectrometers can be used to reveal all the hidden secrets in your samples.
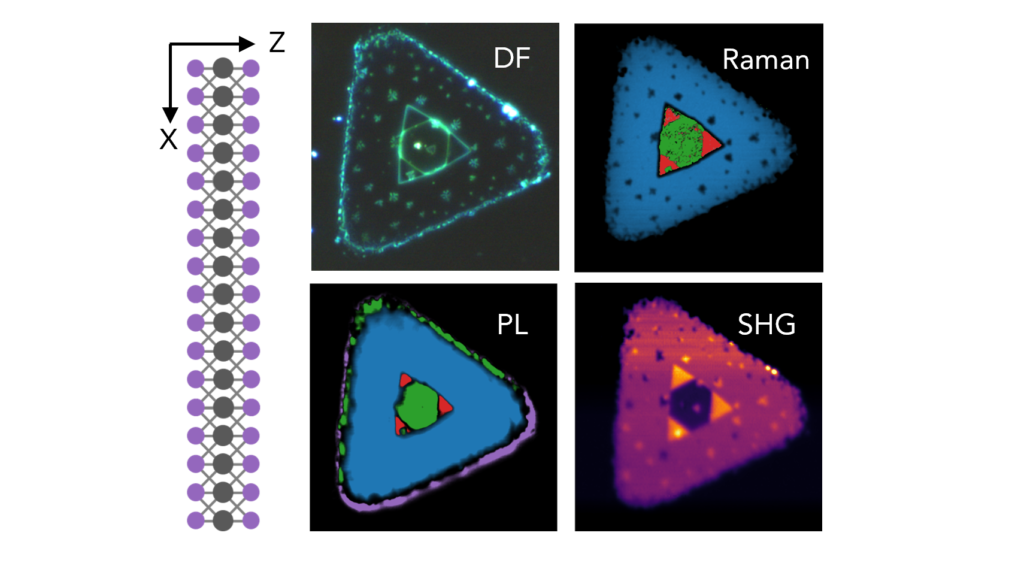
Tungsten diselenide (WSe2) is a multifunctional semiconducting material that possesses distinctive layer-dependent electronic and optical properties and has the potential for use in several different research applications. Comprehensive characterisation of these properties can be achieved by compiling information from multiple microscopic and spectroscopic techniques. In our recent Application Note, a crystal of chemical vapour deposition (CVD) grown WSe2 was characterised using the RMS1000 Confocal Microscope with five different imaging modalities: reflected brightfield (BF) and darkfield (DF), Raman, photoluminescence (PL), and second harmonic generation (SHG), Figure 1. As each modality was sequentially used to image the crystal, more information about its properties was afforded and assumptions about previously observed effects were able to be confirmed.
The crystal was first widefield imaged using reflected BF and DF settings on the microscope. In BF, Figure 1a, the crystal absorbs light and so appears darker than the substrate that it is deposited on. We can also see dark spots on the crystal that are attributed to nucleation sites, as well as a strongly absorbing triangular region in the centre of the crystal that suggests multilayer WSe2. In DF, Figure 1b, where oblique angle illumination causes any steps in the sample surface height to scatter the light into the microscope objective, the central triangular region is revealed to contain two regions with different heights. This is likely to be due to different WSe2 layer numbers, and spectroscopic analysis can tell us more about it.
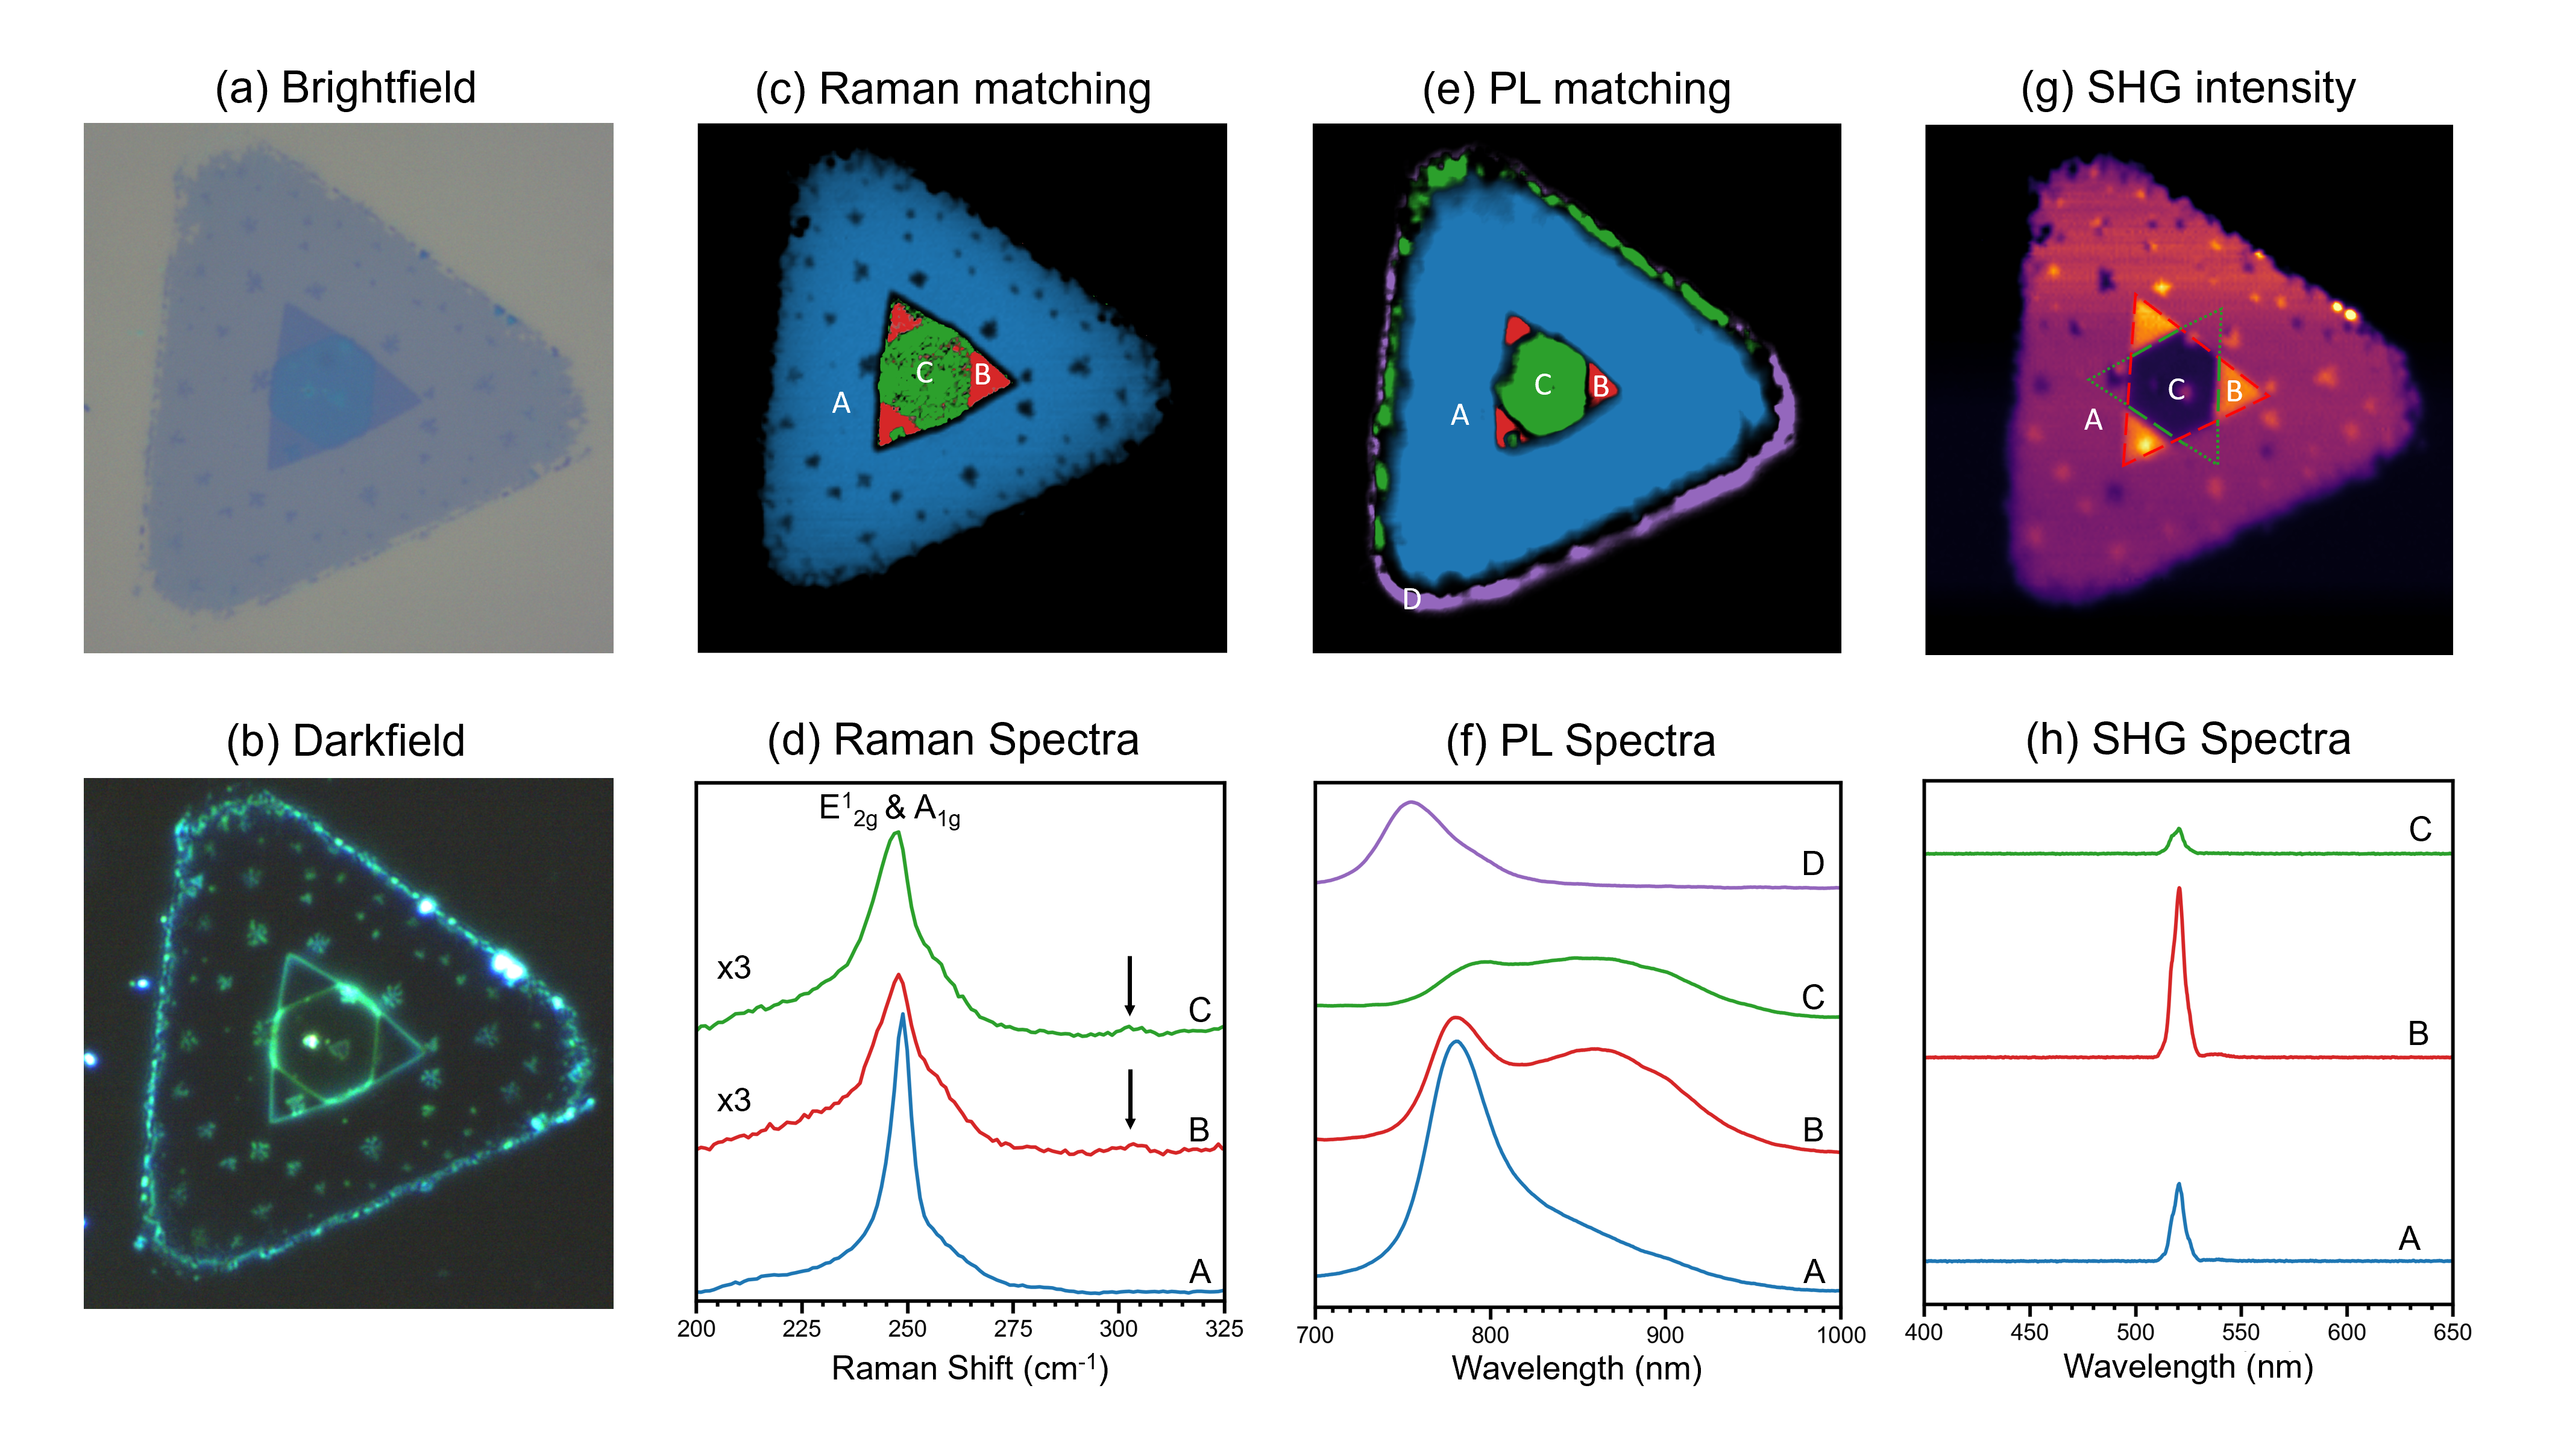
Figure 1. Multimodal imaging of a WSe2 crystal using the RMS1000 Confocal Microscope.
The crystal was then imaged using Raman, Figure 1c. WSe2 has a Raman peak at 250 cm-1, Figure 1d, that corresponds to the in-plane E12g and A1g phonon modes of WSe2. In the centre of the crystal, which absorbed more in BF and exhibited edge effects in DF, an additional peak at 310 cm-1 can be seen and is highlighted in Figure 1d using arrows. This peak is indicative of multilayer WSe2 because it is symmetry forbidden in the monolayer form of the material. Ramacle® spectral matching analysis, which takes into account the intensity, shape, and Raman shift of all the peaks within the spectrum, was then used to identify three different spectral regions in the crystal. The blue region on the Raman image of the crystal is monolayer WSe2, and the inner triangular region is made up of two different red and green regions, which match the DF image, with slightly different E12g and A1g peaks.
PL imaging was next used to obtain more information about the heterogeneous central domain of the crystal, Figure 1e. PL spectral matching confirmed the same spectrally distinct regions on the crystal as Raman, but the extracted spectra were much more easily distinguishable, Figure 1f. In the red region of the central domain, the PL intensity is decreased relative to the monolayer region and a longer wavelength shoulder peak is also seen at 870 nm. In the green region, the original monolayer PL peak is decreased further, and the longer wavelength shoulder becomes more pronounced. These spectral effects are consistent with the change in bandgap observed as 2D layers of WSe2 approach the bulk material, and therefore the red and green regions were assigned as bilayer and trilayer, respectively.
Finally, to determine the layer orientation within these three distinct regions, SHG imaging was performed on the crystal, Figure 1g. SHG is highly sensitive to the crystalline symmetry of WSe2, and it will only be seen if there is non-centrosymmetry in the measured volume. The monolayer region of the crystal is non-centrosymmetric and hence produces an SHG response. The stacking orientation of multilayer WSe2 means that odd-numbered multilayers are net non-centrosymmetric and hence produce SHG with intensity increasing with the number of layers, and even-numbered multilayers are centrosymmetric and produce no SHG. It then makes sense that in the region shown by PL imaging to be bilayer WSe2, there is a comparably small SHG response, and in the trilayer region the SHG response is greater than the monolayer region, Figure 1h.