Welcome to Edinburgh Instruments monthly blog celebrating our work in Raman, Photoluminescence, and Fluorescence Lifetime Imaging. Every month we will highlight our pick for Map of the Month to show how our spectrometers can be used to reveal all the hidden secrets in your samples.
2D materials such as transition metal dichalcogenides (TMDs) have unique optical and electronic properties offering endless applications in areas such as photodetectors and light emitting diodes. They have the chemical formulae MX2, where M is a transition metal and X is a chalcogen, Figure 1 (a). MoS2 is one of the most widely studied TMDs, its crystal structure is a hexagonal plane of S atoms on either side of a hexagonal plane of Mo atoms. Individual layers of MoS2 have significantly different properties to bulk material, removing interlayer interactions creates a direct bandgap with an increased energy. This direct bandgap is what makes TMDs so attractive to research scientists, therefore being able to determine the presence of single layer MoS2 is critical.
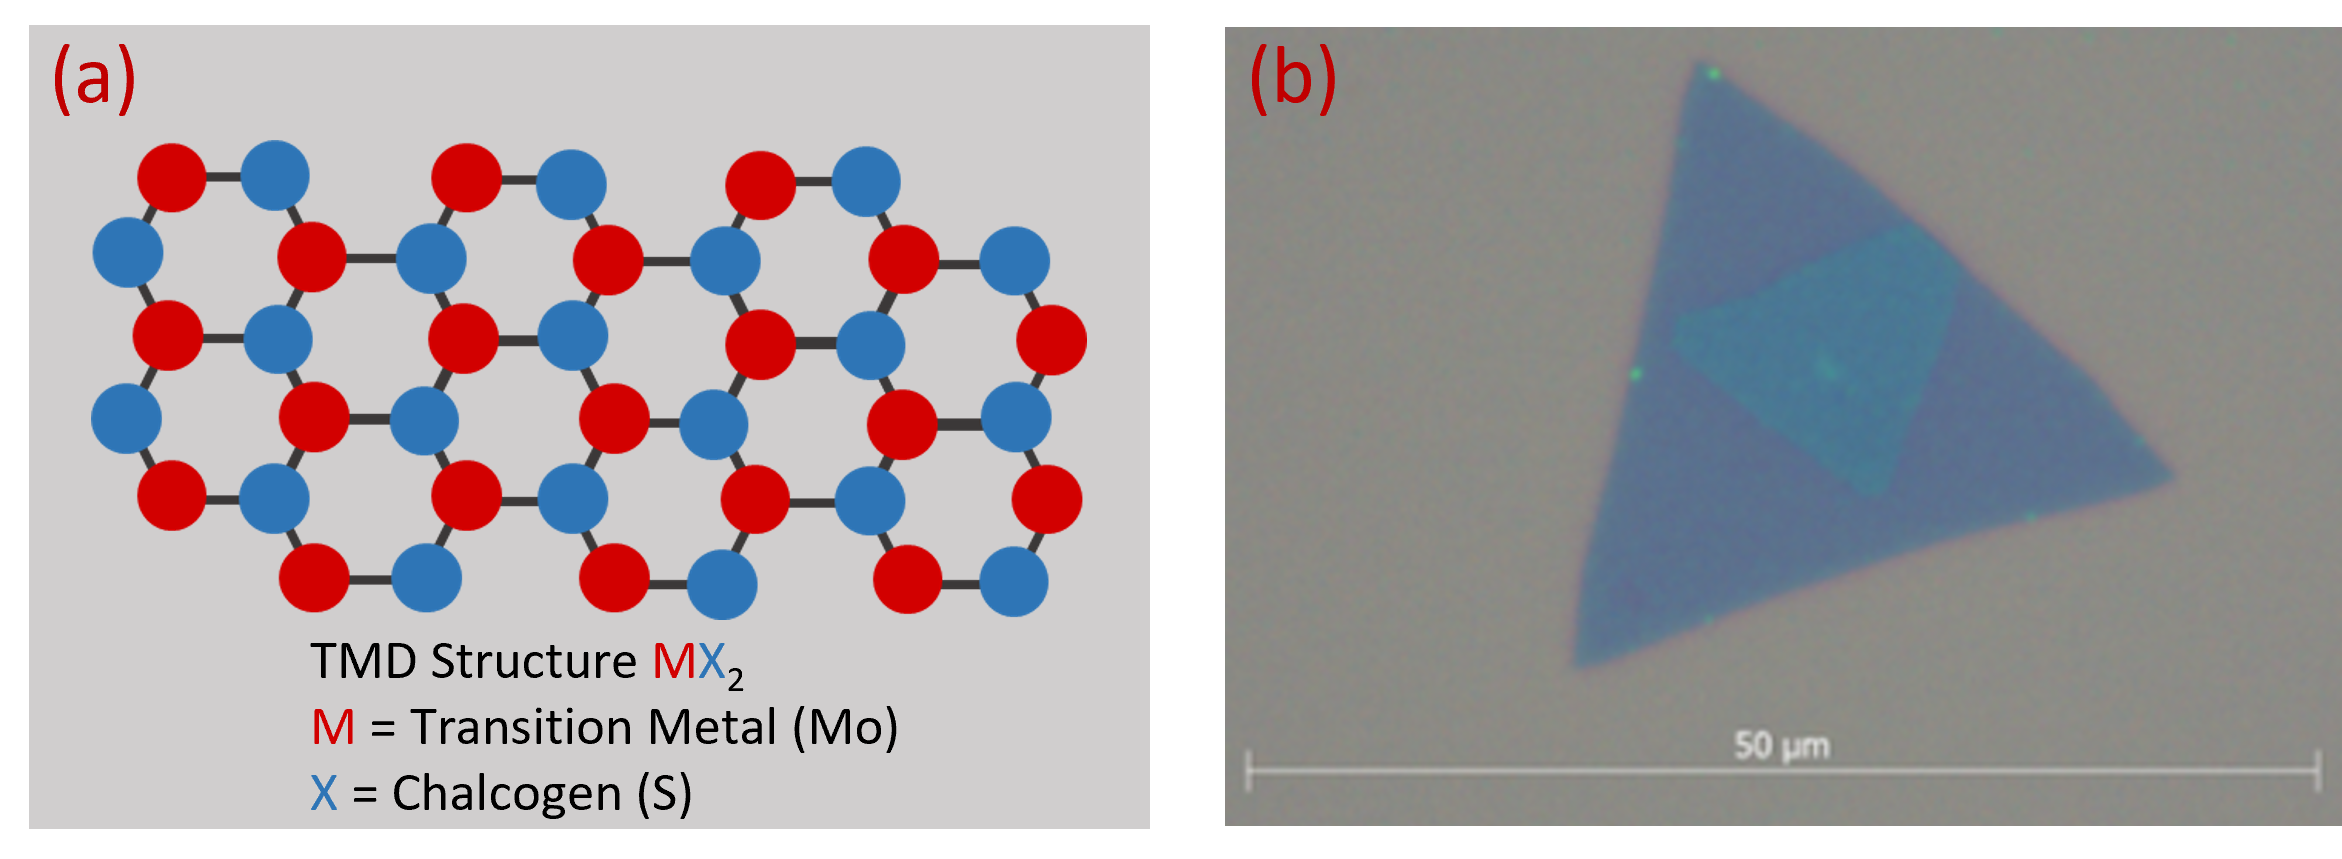
Figure 1: (a) TMD structure (b) White light microscopy image of a MoS2 flake
Flakes of MoS2, Figure 1 (b), are commonly studied by Raman microscopy to determine if the sample is monolayer or multilayer. MoS2 has a strong Raman response, this means that we can use short exposure times when mapping. In standard mapping, time is spent accelerating and decelerating the stage as it moves from point to point. The shorter the exposure time, the more significant this stage movement time is to the total acquisition time of the map. The solution to this is Ramacle’s® Fast Mapping feature, where the stage continuously moves the sample during the map. With Fast Mapping, the additional stage movement time is removed, and total acquisition times can be significantly reduced, Figure 2.

Figure 2: Fast Mapping.
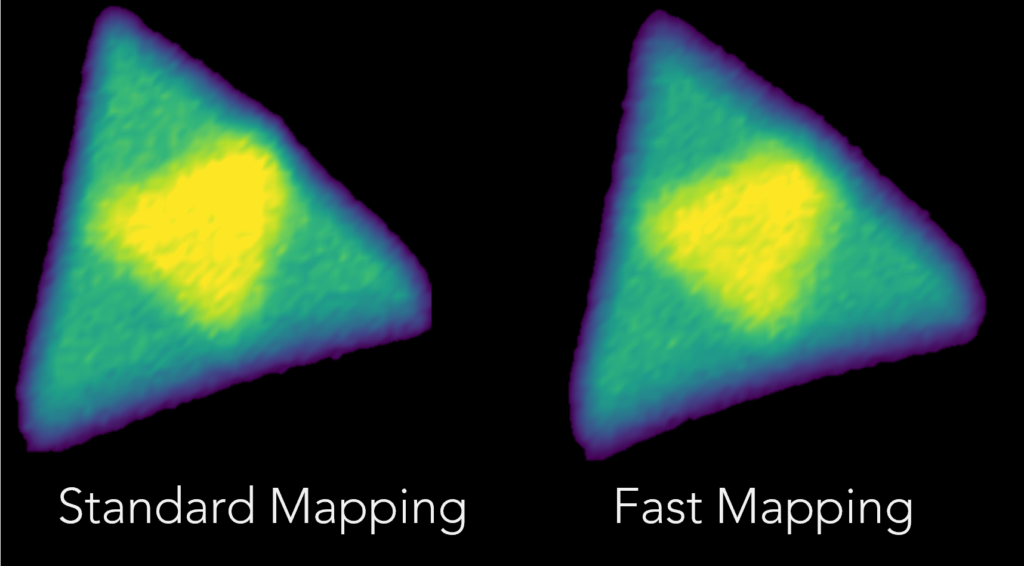
Using identical Raman conditions, a Raman map was taken of MoS2 with standard and Fast Mapping. The total map acquisition time using standard mapping was 16 minutes and this was reduced to 4 minutes using Fast Mapping. Despite obtaining the map 4 times faster using Fast Mapping, there is no reduction in mapping quality, Figure 3. The MoS2 maps from both mapping methods are comparable, revealing the same sample information. Raman mapping is used on MoS2 samples to show areas of mono- and multi-layers by the intensity of its E2g and A1g bands. Areas of higher intensity represent multi-layer MoS2.

Figure 3: Raman intensity maps of MoS2 using standard (left) and Fast Mapping (right).
Our Fast Mapping Software Highlight short video goes into more detail about how you can use Fast Mapping. In fact, we can go even faster than shown here, meaning the final Fast Map is over 10 times faster than the original standard map! Find out more in our software highlight, or contact a member of our sales team to discuss all the tools Ramacle® has to offer for your samples.