Welcome to Edinburgh Instruments monthly blog celebrating our work in Raman, Photoluminescence, and Fluorescence Lifetime Imaging. Every month we will highlight our pick for Map of the Month to show how our spectrometers can be used to reveal all the hidden secrets in your samples.
In the pharmaceutical industry knowing the composition of tablets is important both for research and development and quality control. Raman microscopy is the perfect technique to carry out such analysis, its fingerprint like level of spectral identification means active pharmaceutical ingredients (APIs) can easily be distinguished with details of crystallinity and polymorphism obtained. When coupled to a confocal microscope we can now get comprehensive information on the distribution of the APIs.
Raman microscopy is a non-destructive technique meaning whole pharmaceutical tablets can be analysed without any risk to their structure or effectiveness. The entire tablet can be Raman mapped, one issue with this approach is the nature of tablets – they are not perfectly flat. The surface is rough, and tablets are frequently branded with letters or contain a dip in the middle meant to aid breaking for half doses.
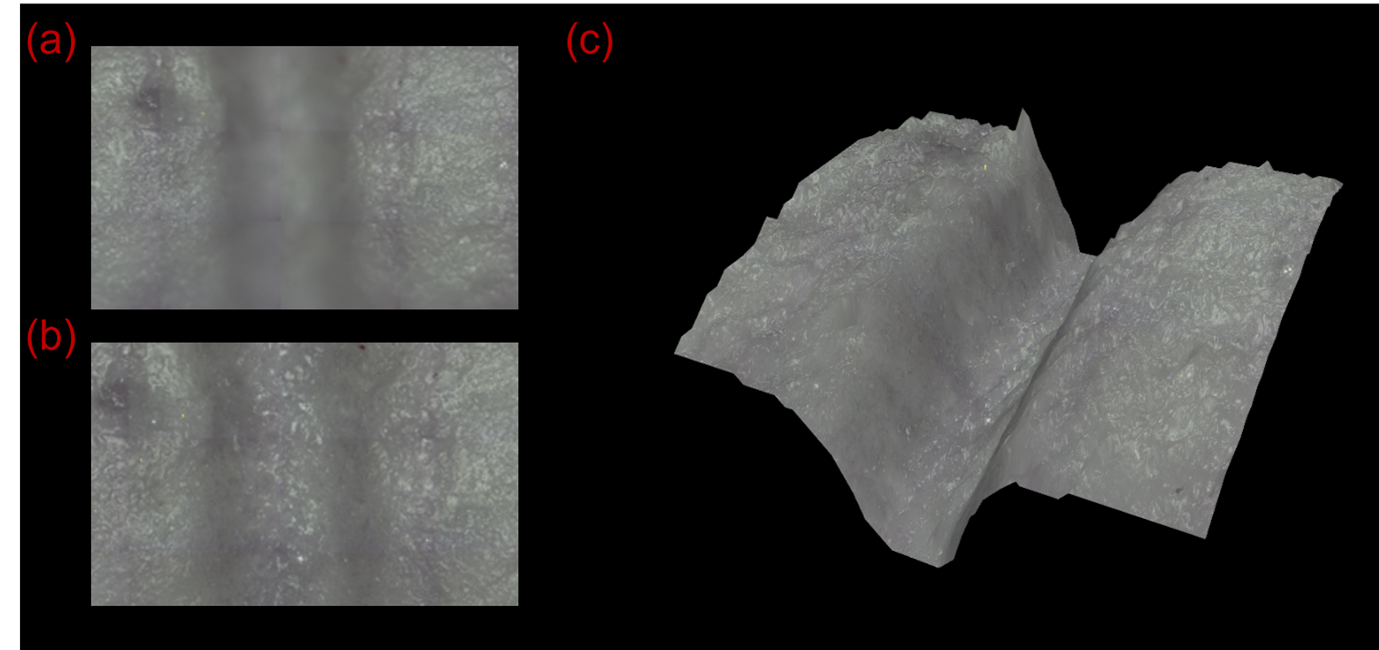
Figure 1: (a) Out of focus white light image at a single Z point, (b) 2D representation of a Surface Image (c) 3D topography view of a Surface Image
Ramacle® tackles uneven surfaces using Surface Mapping. Here a fully focused Surface Image is obtained from taking Z-stack images through the entire sample surface height and processing them to form one optimally focused image, Figure 1. The Z axis values for each XY point are stored in Ramacle® and now the Raman map can be obtained ensuring all points are perfectly focused, Figure 2.
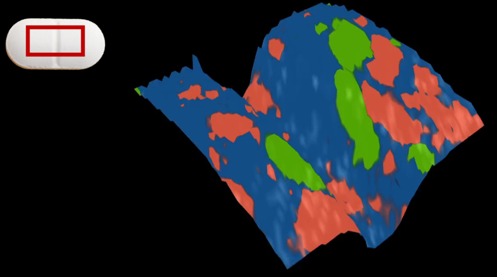
Figure 2: 3D topography view of a pharmaceutical tablet false coloured (left) and its spectra (right). Paracetamol shown in blue, aspirin in coral, and caffeine in green.
Figure 2 shows the resulting Raman Surface Map, which shows the sample in focus throughout the entire measurement. The tablet’s surface shape can clearly be seen, and the 3 APIs are spatially well resolved and identified as paracetamol (blue), aspirin (coral), and caffeine (green).
If you would like to know more our Ramacle® Software Highlight: Surface Mapping video gives a more thorough explanation on how to handle uneven surfaces.
If you have enjoyed reading this application note, why not sign-up to our monthly eNewsletter via the button below or follow us on your favourite social media channel in the footer below to keep up to date with our latest news and research.