Skip to content
Skip to content
  • News
  • Events
  • eBooks
  • Blog
  • Careers
  • Contact
  • News
  • Events
  • eBooks
  • Blog
  • Careers
  • Contact
KNOWLEDGEBASE
  • About Us
  • Products

    Fluorescence Spectrometers

    • FLS1000 Photoluminescence Spectrometer
    • FS5 Spectrofluorometer
    • LifeSpec II Lifetime Spectrometer
    • Mini-tau Lifetime Spectrometer

    Raman Microscopes

    • RM5 Raman Microscope
    • RMS1000 Multimodal Confocal Microscope

    Transient Absorption

    • LP980 Transient Absorption Spectrometer

    FTIR Spectrometers

    • IR5 FTIR Spectrometer

    Lasers and LEDs

    • Pulsed Lasers
    • Gas Lasers
    • Customisation Options
    View All Products
  • Techniques
  • Applications
KNOWLEDGEBASE
Edit Content
  • About Us
  • Products
  • Techniques
  • Applications
  • Knowledgebase
  • eBooks
  • News
  • Events
  • Blog
  • Careers
  • Contact Us
  1. Home
  2. Blog Post
  3. Blood Analysis Using Raman Spectroscopy

BLOG

Blood Analysis Using Raman Spectroscopy

  • October 27, 2021
Edit Content

Did you know, on average, a human contains about 5 litres of blood with the heart pumping around 240 million litres in a person’s average lifetime? Blood is the fluid that circulates around our body providing nutrients, oxygen, and waste removal. It can tell us a lot about our own body’s health.

In a sample of blood, plasma makes up just over half of it, plasma is an aqueous solution made up mostly of water and proteins which serve many important functions in the body. The main components of the remaining blood are made up of three types of blood cells; red blood cells (responsible for carrying oxygen), white blood cells (responsible for fighting infections), and platelets (small cells to help blood clotting in wounds).

Blood can be a good indication of someone’s health, and Raman spectroscopy is a great technique for investigating it. There are a few ways Raman can be used in blood analysis, firstly it can be used to monitor any changes in blood bags for quality control before transfusion, and secondly Raman spectra are useful in aiding disease diagnosis. Numerous articles have been published on Raman spectroscopy’s ability to detect numerous health issues via blood e.g., cancers, viruses such as COVID-19, bacterial and fungal infections, and neurodegenerative disorders such as Huntington’s disease.1–5 Raman spectroscopy is particularly suited to analysing blood due to its high sensitivity for biomolecules, rapid analysis and results, lack of sample prep, and non-destructive nature.Constituents of plasma and serum | blood analysis

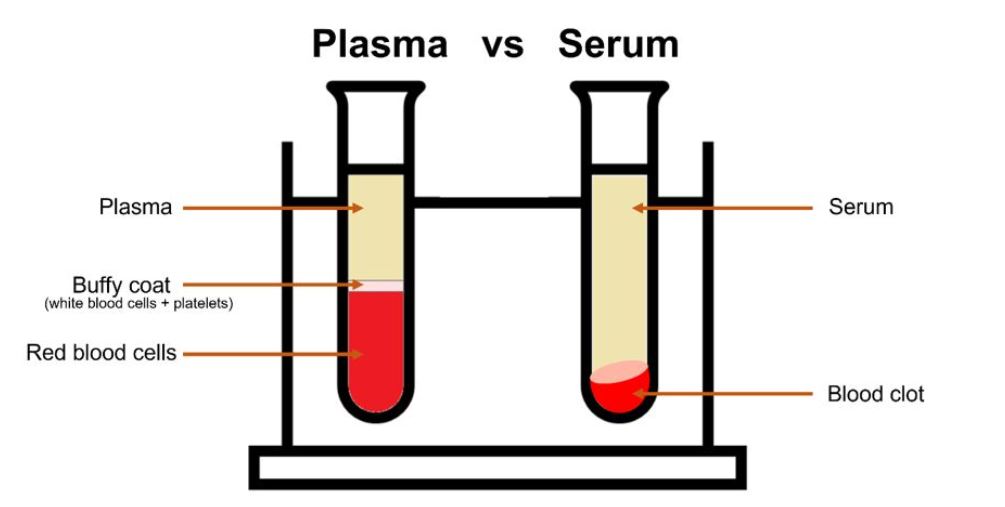
Figure 1: Plasma vs serum

The best way to analyse blood via Raman spectroscopy is by analysing the plasma or the serum. Plasma, as mentioned, is an aqueous solution which is separated from the rest of the blood components by centrifugation in anti-coagulant tubes. Serum is the liquid that remains after the blood has clotted, to isolate serum a blood sample is allowed to clot and then centrifuged with the remaining liquid supernatant the serum. Serum is most widely used in research due to the more efficient removal of red blood cells resulting in more volume per unit of blood. Both are usually studied with a 785 nm laser line, or further into the NIR, due to the fluorescence seen with visible lasers in the region of 600-700 nm e.g., 638 nm and the resonance Raman from β-carotene at 532 nm and 475 nm excitation.

Within plasma and serum, there are globulin and albumin proteins. The most abundant protein is human albumin (HA), making up approximately half of the protein content. It acts as a transport protein, supports the osmotic pressure, and contributes to metabolic processes. As it is such a major component of blood, we have investigated the spectra of albumin.

Blood analysis spectra

Figure 2: Raman spectrum of human serum albumin with band assignments.6

The spectral region of interest, shown in Figure 2, is commonly termed the fingerprint region. This is because the spectra are highly specific and therefore provide great insight into the sample. We can see a series of bands which can be attributed to stretching and deformation vibrations within the molecule. The strong peak at 1004 cm-1 is phenylalanine, an amino acid which is a building block of proteins. This peak is frequently used in Raman spectroscopy as a calibration/reference point as unlike other Raman bands its position does not suffer from interference from other molecules such as lipids, water, and nucleic acids. This is extremely useful when looking at subtle peak changes as it proves these are real shifts if the phenylalanine peak remains constant.  We see the presence of other amino acids as well as bands from amides and other functional groups.

For more on Raman spectroscopy, please visit our learning centre or take a look at our application notes.

References

  1. J. González-Solís, Discrimination of different cancer types clustering Raman spectra by a super pragmatic stochastic network approach, PLoS One, 2019, 14, e0213621.
  2. A. Huefner et al., Serum Raman spectroscopy as a diagnositc tool in patients with Huntington’s diesease, Chem. Sci., 2020, 11, 525–533.
  3. G. W. Auner et al., Applications of Raman spectroscopy in cancer diagnosis, Cancer Metastasis Rev., 2018, 37, 691.
  4. G. Yin et al., An efficient primary screening of COVID-19 by serum Raman spectroscopy, J. Raman Spectrosc., 2021, 52, 949–958.
  5. N. Arend et al., High-throughput screening Raman spectroscopy platform for label-free cellomics Anal. Chem., 2020, 92, 10560–10568.
  6. N. C. Dingari et al., Raman spectroscopy provides a powerful diagnostic tool for accurate determination of albumin glycation, PLoS One, 2012, 7, e32406.

Edinburgh Instruments Confocal Raman Microscopes

If you want to know more about our range of confocal Raman microscopes, please get in touch with one of our sales team. We would be happy the help discover the best spectroscopic solution for your laboratory.

RELATED PRODUCTS

RMS1000

Multimodal Confocal Microscope

VIEW

RM5

Raman Microscope

VIEW

RESOURCES

Tags:
  • Life Science
  • RM5
  • RMS1000
  • Raman
Related Posts:

No results found.

Application Notes:
Suggested Reading:

What is Resonance Raman Spectroscopy?

View more »
Share:
PrevPrevious
NextNext

Keep up to date with the latest from Edinburgh Instruments

Join our mailing list and keep up with our latest videos, app notes and more!

LOCATION:
  • Edinburgh Instruments Ltd.
    2 Bain Square, Kirkton Campus, Livingston, EH54 7DQ.
  • sales@edinst.com
  • +44 1506 425 300
ABOUT:
  • About Us
  • Techniques
  • Applications
  • Knowledgebase
  • About Us
  • Techniques
  • Applications
  • Knowledgebase
PRODUCTS:
  • Fluorescence Spectrometers
  • Raman Microscopes
  • UV-Vis Spectrophotometers
  • Transient Absorption
  • FTIR Spectrometers
  • Lasers and LEDs
  • Customisation Options
  • Software
  • Upgrades
  • All Products
  • Fluorescence Spectrometers
  • Raman Microscopes
  • UV-Vis Spectrophotometers
  • Transient Absorption
  • FTIR Spectrometers
  • Lasers and LEDs
  • Customisation Options
  • Software
  • Upgrades
  • All Products
LEGALS:
  • News
  • Events
  • Blog
  • Careers
  • Contact Us
  • Terms and Conditions
  • Privacy Policy
  • News
  • Events
  • Blog
  • Careers
  • Contact Us
  • Terms and Conditions
  • Privacy Policy
SOCIALS:
Youtube Linkedin X-twitter Facebook
©2024 Edinburgh Instruments. Registered in England and Wales No: 962331. VAT No: GB 271 7379 37
Manage Consent
To provide the best experiences, we use technologies like cookies to store and/or access device information. Consenting to these technologies will allow us to process data such as browsing behaviour or unique IDs on this site. Not consenting or withdrawing consent, may adversely affect certain features and functions.
Functional Always active
The technical storage or access is strictly necessary for the legitimate purpose of enabling the use of a specific service explicitly requested by the subscriber or user, or for the sole purpose of carrying out the transmission of a communication over an electronic communications network.
Preferences
The technical storage or access is necessary for the legitimate purpose of storing preferences that are not requested by the subscriber or user.
Statistics
The technical storage or access that is used exclusively for statistical purposes. The technical storage or access that is used exclusively for anonymous statistical purposes. Without a subpoena, voluntary compliance on the part of your Internet Service Provider, or additional records from a third party, information stored or retrieved for this purpose alone cannot usually be used to identify you.
Marketing
The technical storage or access is required to create user profiles to send advertising, or to track the user on a website or across several websites for similar marketing purposes.
Manage options Manage services Manage {vendor_count} vendors Read more about these purposes
View preferences
{title} {title} {title}