Skip to content
Skip to content
  • News
  • Events
  • eBooks
  • Blog
  • Careers
  • Contact
  • News
  • Events
  • eBooks
  • Blog
  • Careers
  • Contact
KNOWLEDGEBASE
  • About Us
  • Products

    Fluorescence Spectrometers

    • FLS1000 Photoluminescence Spectrometer
    • FS5 Spectrofluorometer
    • LifeSpec II Lifetime Spectrometer
    • Mini-tau Lifetime Spectrometer

    Raman Microscopes

    • RM5 Raman Microscope
    • RMS1000 Multimodal Confocal Microscope

    Transient Absorption

    • LP980 Transient Absorption Spectrometer

    FTIR Spectrometers

    • IR5 FTIR Spectrometer

    Lasers and LEDs

    • Pulsed Lasers
    • Gas Lasers
    • Customisation Options
    View All Products
  • Techniques
  • Applications
KNOWLEDGEBASE
Edit Content
  • About Us
  • Products
  • Techniques
  • Applications
  • Knowledgebase
  • eBooks
  • News
  • Events
  • Blog
  • Careers
  • Contact Us

RESOURCES

What is a Stern-Volmer Plot?

  • May 7, 2024
Edit Content

The Stern-Volmer plot is used to study the interaction dynamics between a fluorescent emitter and a quencher (a substance that reduces the fluorescence intensity). The plot shows the ratio of the fluorescence intensity as a function of the quencher’s concentration [Q], described by Eq. 1:


Where I0 and I are the fluorescence intensity in the absence and presence of a quencher respectively and KSV is the Stern-Volmer constant. For systems showing only dynamic quenching, KSV can be determined from the slope of the Stern-Volmer plot, as shown in Figure 1. 


Figure 1. Example of an intensity Stern-Volmer plot of the system fac-Ir(ppy)3 and the quencher 2,4dinitrotoluene. The slope provides the Stern-Volmer constant. 

The Stern-Volmer constant provides information about the sensitivity of the quenching system and, for dynamic quenching, is given by Eq. 2: Where τ0 is the fluorescence lifetime of the emitter in the absence of a quencher, and kq is the bimolecular quenching constant. The constant kq describes how efficiently the quencher suppresses the emission intensity of the system, and its value is typically in the range of 109 – 1010 M−1 s−1.1,2  

Since the relative change in intensity I0/I is proportional to a corresponding change in fluorescence lifetime, Eq. 1 can also be written as a function of lifetime (Eq. 3). This allows a dynamic quenching interaction to also be characterised from changes in the fluorescence lifetime. The Stern-Volmer constant KSV and bimolecular quenching constant, kq, can be determined as a function of changes in lifetime with quencher concentration (Figure 2).  

Figure 2. Example of a lifetime Stern-Volmer plot of the system fac-Ir(ppy)3 and the quencher 2,4dinitrotoluene. The slope provides the Stern-Volmer constant. 


What Causes Non-Linear Deviations in the Stern-Volmer Plot? 

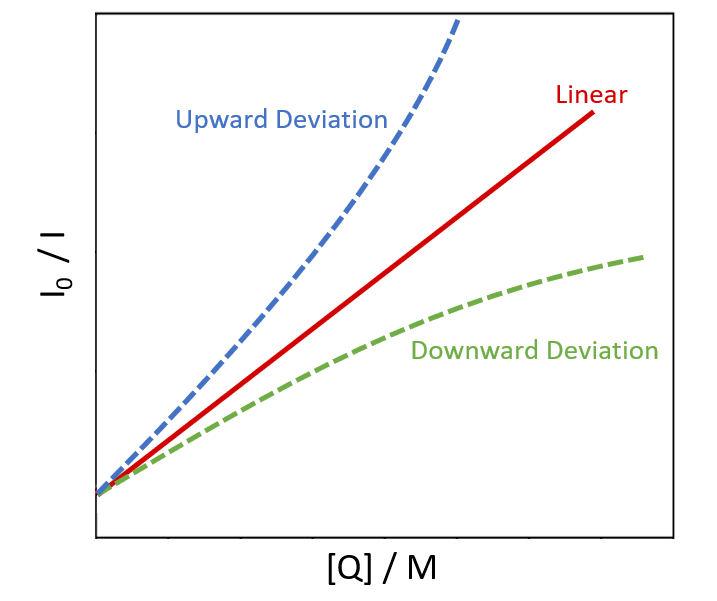
A linear relationship in the Stern-Volmer (SV) plot is the most common behaviour of fluorescence quenching. However, upward, or downward deviation behaviour is also possible (Figure 3). 

Figure 3. Stern-Volmer plot for quenching systems showing linear relationship (red curve); upward deviation relationship (blue curve); and downward deviation (green curve). 

A linear relationship is most associated with dynamic quenching, where the quenching is mainly due to collisions between the emitter and quencher molecules. However, the linear relationship on the Stern-Volmer plot can also be associated with a purely static quenching system. Since static quenching does not show changes in the emission lifetime as a function of the quencher concentration lifetime measurements can be used to distinguish between the two.1  

The upward/positive deviation is found in systems in which both static and dynamic quenching are contributing to the decrease in fluorescence intensity. A downward/negative deviation is generally associated with the presence of two emitters with different Stern-Volmer constants, e.g., for the same concentration of quencher, the emitters will be quenched at different rates. In most cases, at lower concentrations of quencher, a linear relationship is evident; however, as the quencher concentration increases, the relationship becomes non-linear.   
 

RELATED PRODUCTS

FLS1000

Photoluminescence Spectrometer

VIEW

FS5

Spectrofluorometer

VIEW

Contact our expert team today to find out more about how our products can improve your research

Contact Us
PrevPrevious
NextNext
Previous What is Fluorescence Quenching? Next What is a Fluorescence Spectrometer?

RESOURCES

Tags:
  • Spectral School
  • FLS1000
  • FS5
  • Photoluminescence
Download PDF
Suggested Reading:

What is Photoinduced Electron Transfer?

View more »

What is Dexter Energy Transfer?

View more »

What is Förster Resonance Energy Transfer (FRET)?

View more »

What is Fluorescence Quenching?

View more »

Determining Fluorescence Lifetimes

View more »
Share:

Keep up to date with the latest from Edinburgh Instruments

Join our mailing list and keep up with our latest videos, app notes and more!

LOCATION:
  • Edinburgh Instruments Ltd.
    2 Bain Square, Kirkton Campus, Livingston, EH54 7DQ.
  • sales@edinst.com
  • +44 1506 425 300
ABOUT:
  • About Us
  • Techniques
  • Applications
  • Knowledgebase
  • About Us
  • Techniques
  • Applications
  • Knowledgebase
PRODUCTS:
  • Fluorescence Spectrometers
  • Raman Microscopes
  • UV-Vis Spectrophotometers
  • Transient Absorption
  • FTIR Spectrometers
  • Lasers and LEDs
  • Customisation Options
  • Software
  • Upgrades
  • All Products
  • Fluorescence Spectrometers
  • Raman Microscopes
  • UV-Vis Spectrophotometers
  • Transient Absorption
  • FTIR Spectrometers
  • Lasers and LEDs
  • Customisation Options
  • Software
  • Upgrades
  • All Products
LEGALS:
  • News
  • Events
  • Blog
  • Careers
  • Contact Us
  • Terms and Conditions
  • Privacy Policy
  • News
  • Events
  • Blog
  • Careers
  • Contact Us
  • Terms and Conditions
  • Privacy Policy
SOCIALS:
Youtube Linkedin X-twitter Facebook
©2024 Edinburgh Instruments. Registered in England and Wales No: 962331. VAT No: GB 271 7379 37
Manage Consent
To provide the best experiences, we use technologies like cookies to store and/or access device information. Consenting to these technologies will allow us to process data such as browsing behaviour or unique IDs on this site. Not consenting or withdrawing consent, may adversely affect certain features and functions.
Functional Always active
The technical storage or access is strictly necessary for the legitimate purpose of enabling the use of a specific service explicitly requested by the subscriber or user, or for the sole purpose of carrying out the transmission of a communication over an electronic communications network.
Preferences
The technical storage or access is necessary for the legitimate purpose of storing preferences that are not requested by the subscriber or user.
Statistics
The technical storage or access that is used exclusively for statistical purposes. The technical storage or access that is used exclusively for anonymous statistical purposes. Without a subpoena, voluntary compliance on the part of your Internet Service Provider, or additional records from a third party, information stored or retrieved for this purpose alone cannot usually be used to identify you.
Marketing
The technical storage or access is required to create user profiles to send advertising, or to track the user on a website or across several websites for similar marketing purposes.
Manage options Manage services Manage {vendor_count} vendors Read more about these purposes
View preferences
{title} {title} {title}