Ho ho ho! Welcome to Edinburgh Instruments’ blog celebrating our work in Raman, Photoluminescence, and Fluorescence Lifetime Imaging. Every month, we aim to highlight our pick for Map of the Month to show how our Raman and fluorescence spectrometers can be used to reveal all the hidden secrets in your samples. This December, we bring you the gift of knowledge!
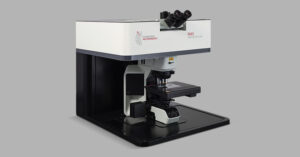
‘Tis the season to be jolly, and for many of us, that means decking the halls with a Christmas tree. Why do people adorn their homes, offices, and public spaces with trees at Christmas? The tradition of displaying Christmas trees dates back centuries, with roots in pagan and Christian customs. Ancient Egyptians, Romans, and Germanic peoples used evergreens to symbolise eternal life during the winter solstice. In the 16th century, German Protestants began decorating trees with candles and ornaments. This tradition still holds today, but artificial Christmas trees have recently become a popular alternative to real trees. Whilst nothing beats the wonderful fragrance you get from the real thing, artificial trees are convenient because they can be used year-on-year and are much less messy to take down in January. How can we tell if our tree is real or fake? Fear not; the Edinburgh Instruments RM5 Confocal Raman Microscope is here to save the day.
Oh, Christmas Tree, Oh, Christmas Tree, Your Secrets We’ll Uncover
Raman spectroscopy is a powerful analytical technique that can be used to identify the chemical composition of almost any material. By shining a laser on a sample, we can measure the inelastically scattered light to determine its molecular structure. When it comes to Christmas trees, Raman spectroscopy can help us forensically distinguish between real and artificial ones. Real trees, like firs and pines, are composed of plant tissue and various biomolecules with distinct Raman spectra. On the other hand, artificial trees are typically made of polyvinylchloride plastic and artificial pigments, which have very different spectral signatures. Although they may look similar to the eye, Raman spectroscopy can differentiate between them in a matter of seconds.
Let It Show, Let It Show, Let It Show the Difference
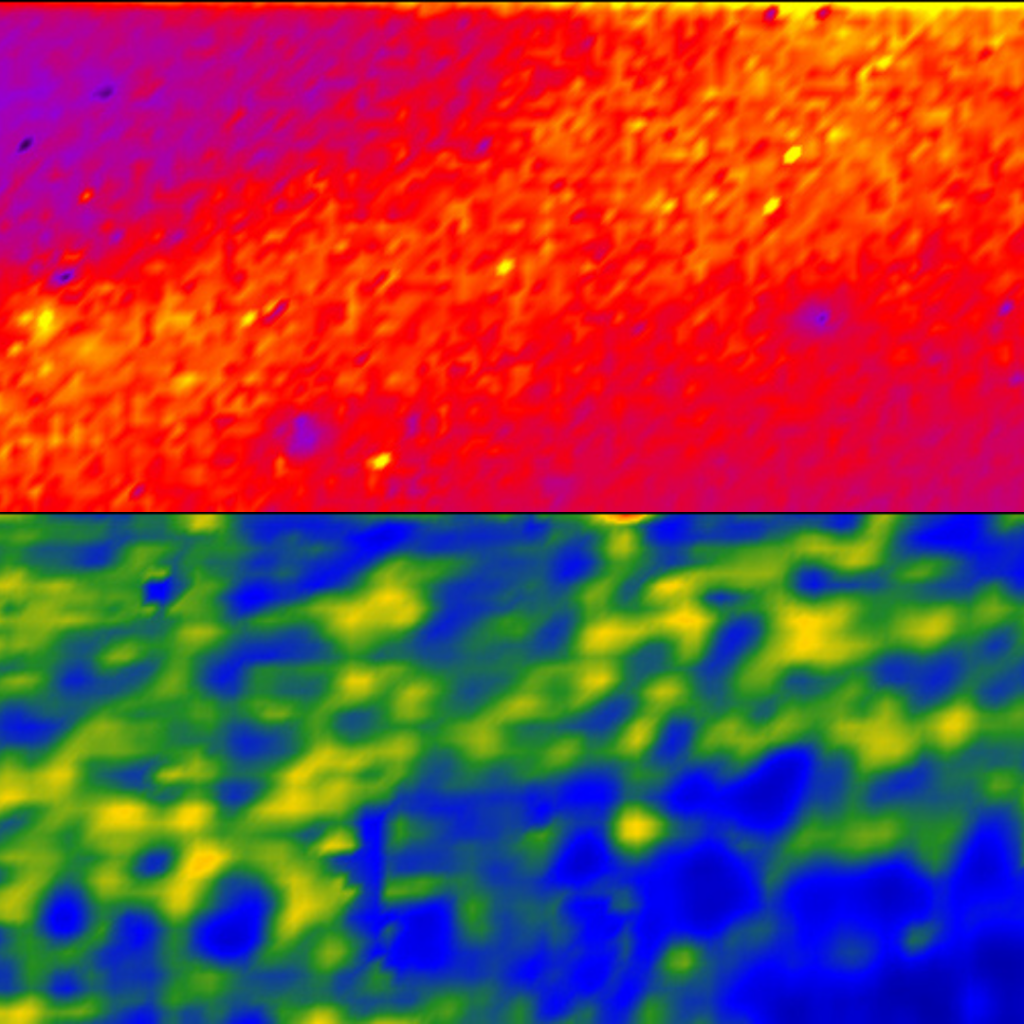
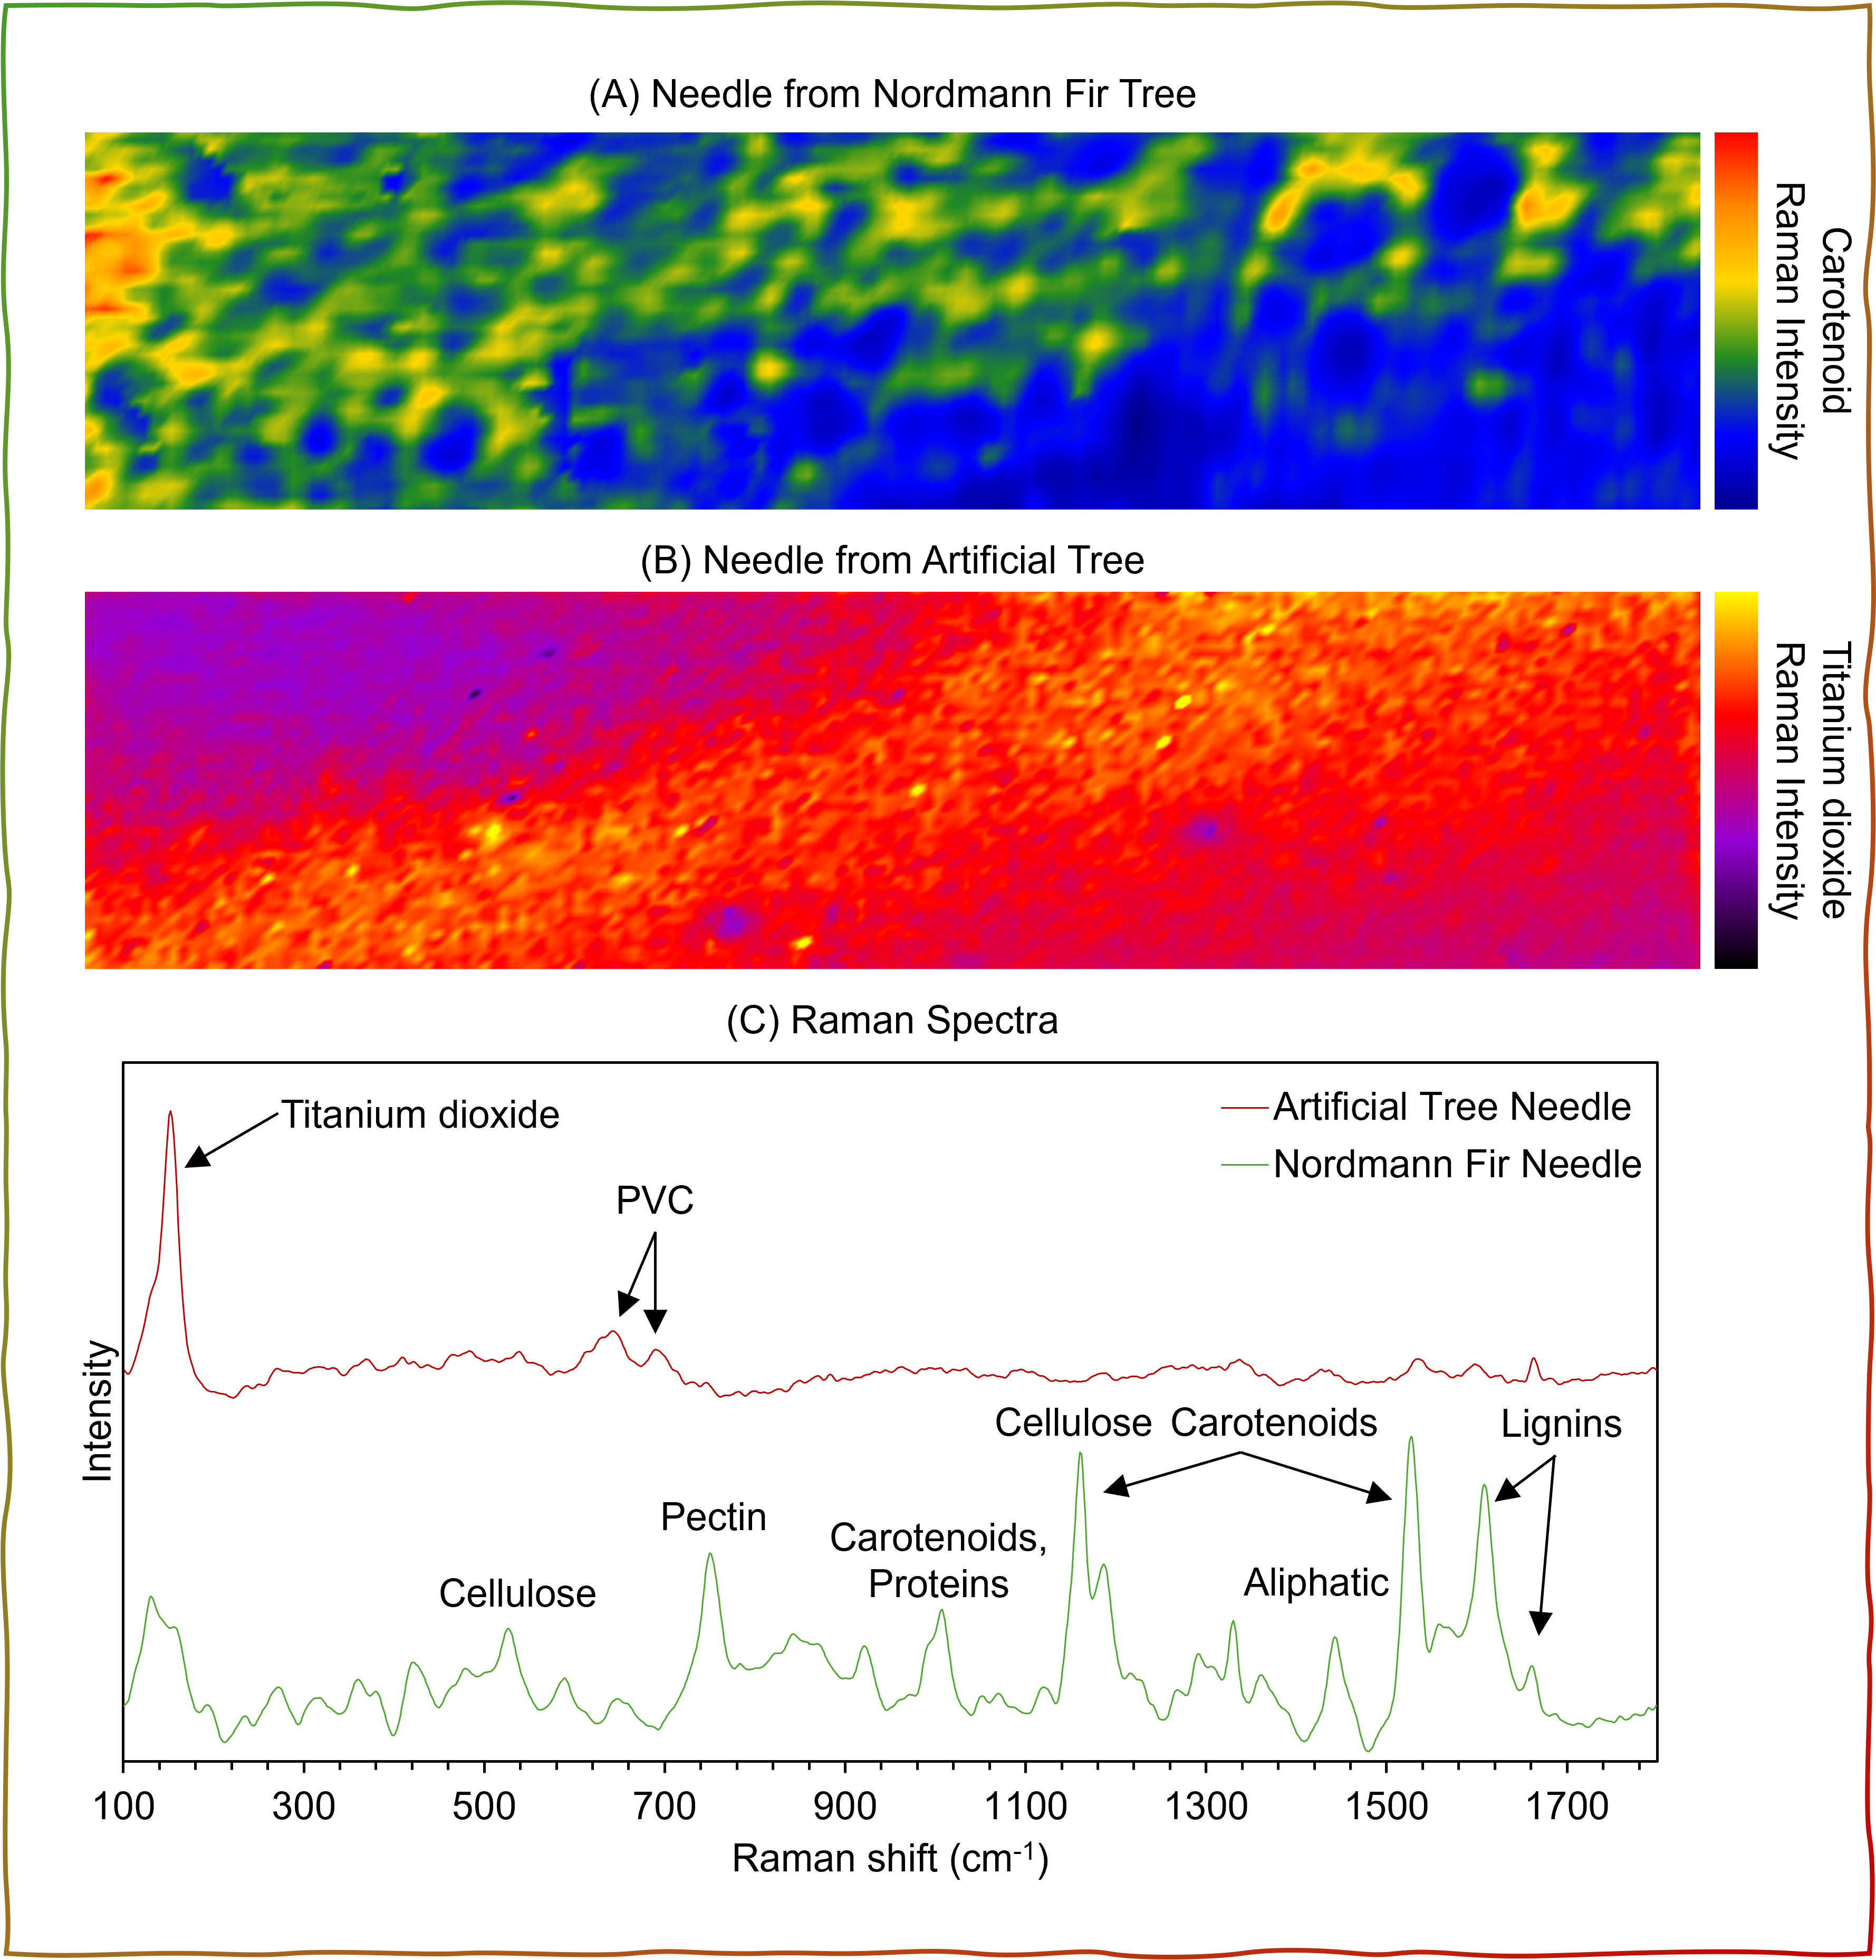
We plucked needles from a real Nordmann fir tree and an artificial one and then analysed them both using the RM5 confocal Raman microscope equipped with a 785 nm laser and a 600 gr/mm diffraction grating. With an X, Y, and Z-automated mapping stage, we acquired Raman images from across both needles. They are shown in the image at the top of the page. We then collected spectra from both images and compared them to determine the main chemical constituents of both types of trees and the key differences between them.
Let’s look at the Nordmann fir tree first. Raman spectroscopy is an emerging tool for the analysis of plant chemistry. It can be used to assess biodiversity, detect bacterial, insect, and fungal infestations and nutrient deficiencies, and perform phenotyping of plant tissue. Such stresses can manifest in changes in the various metabolites that we have detected in our Raman spectrum of the Nordmann fir needle. The peak assignments from this spectrum are shown in the table below.
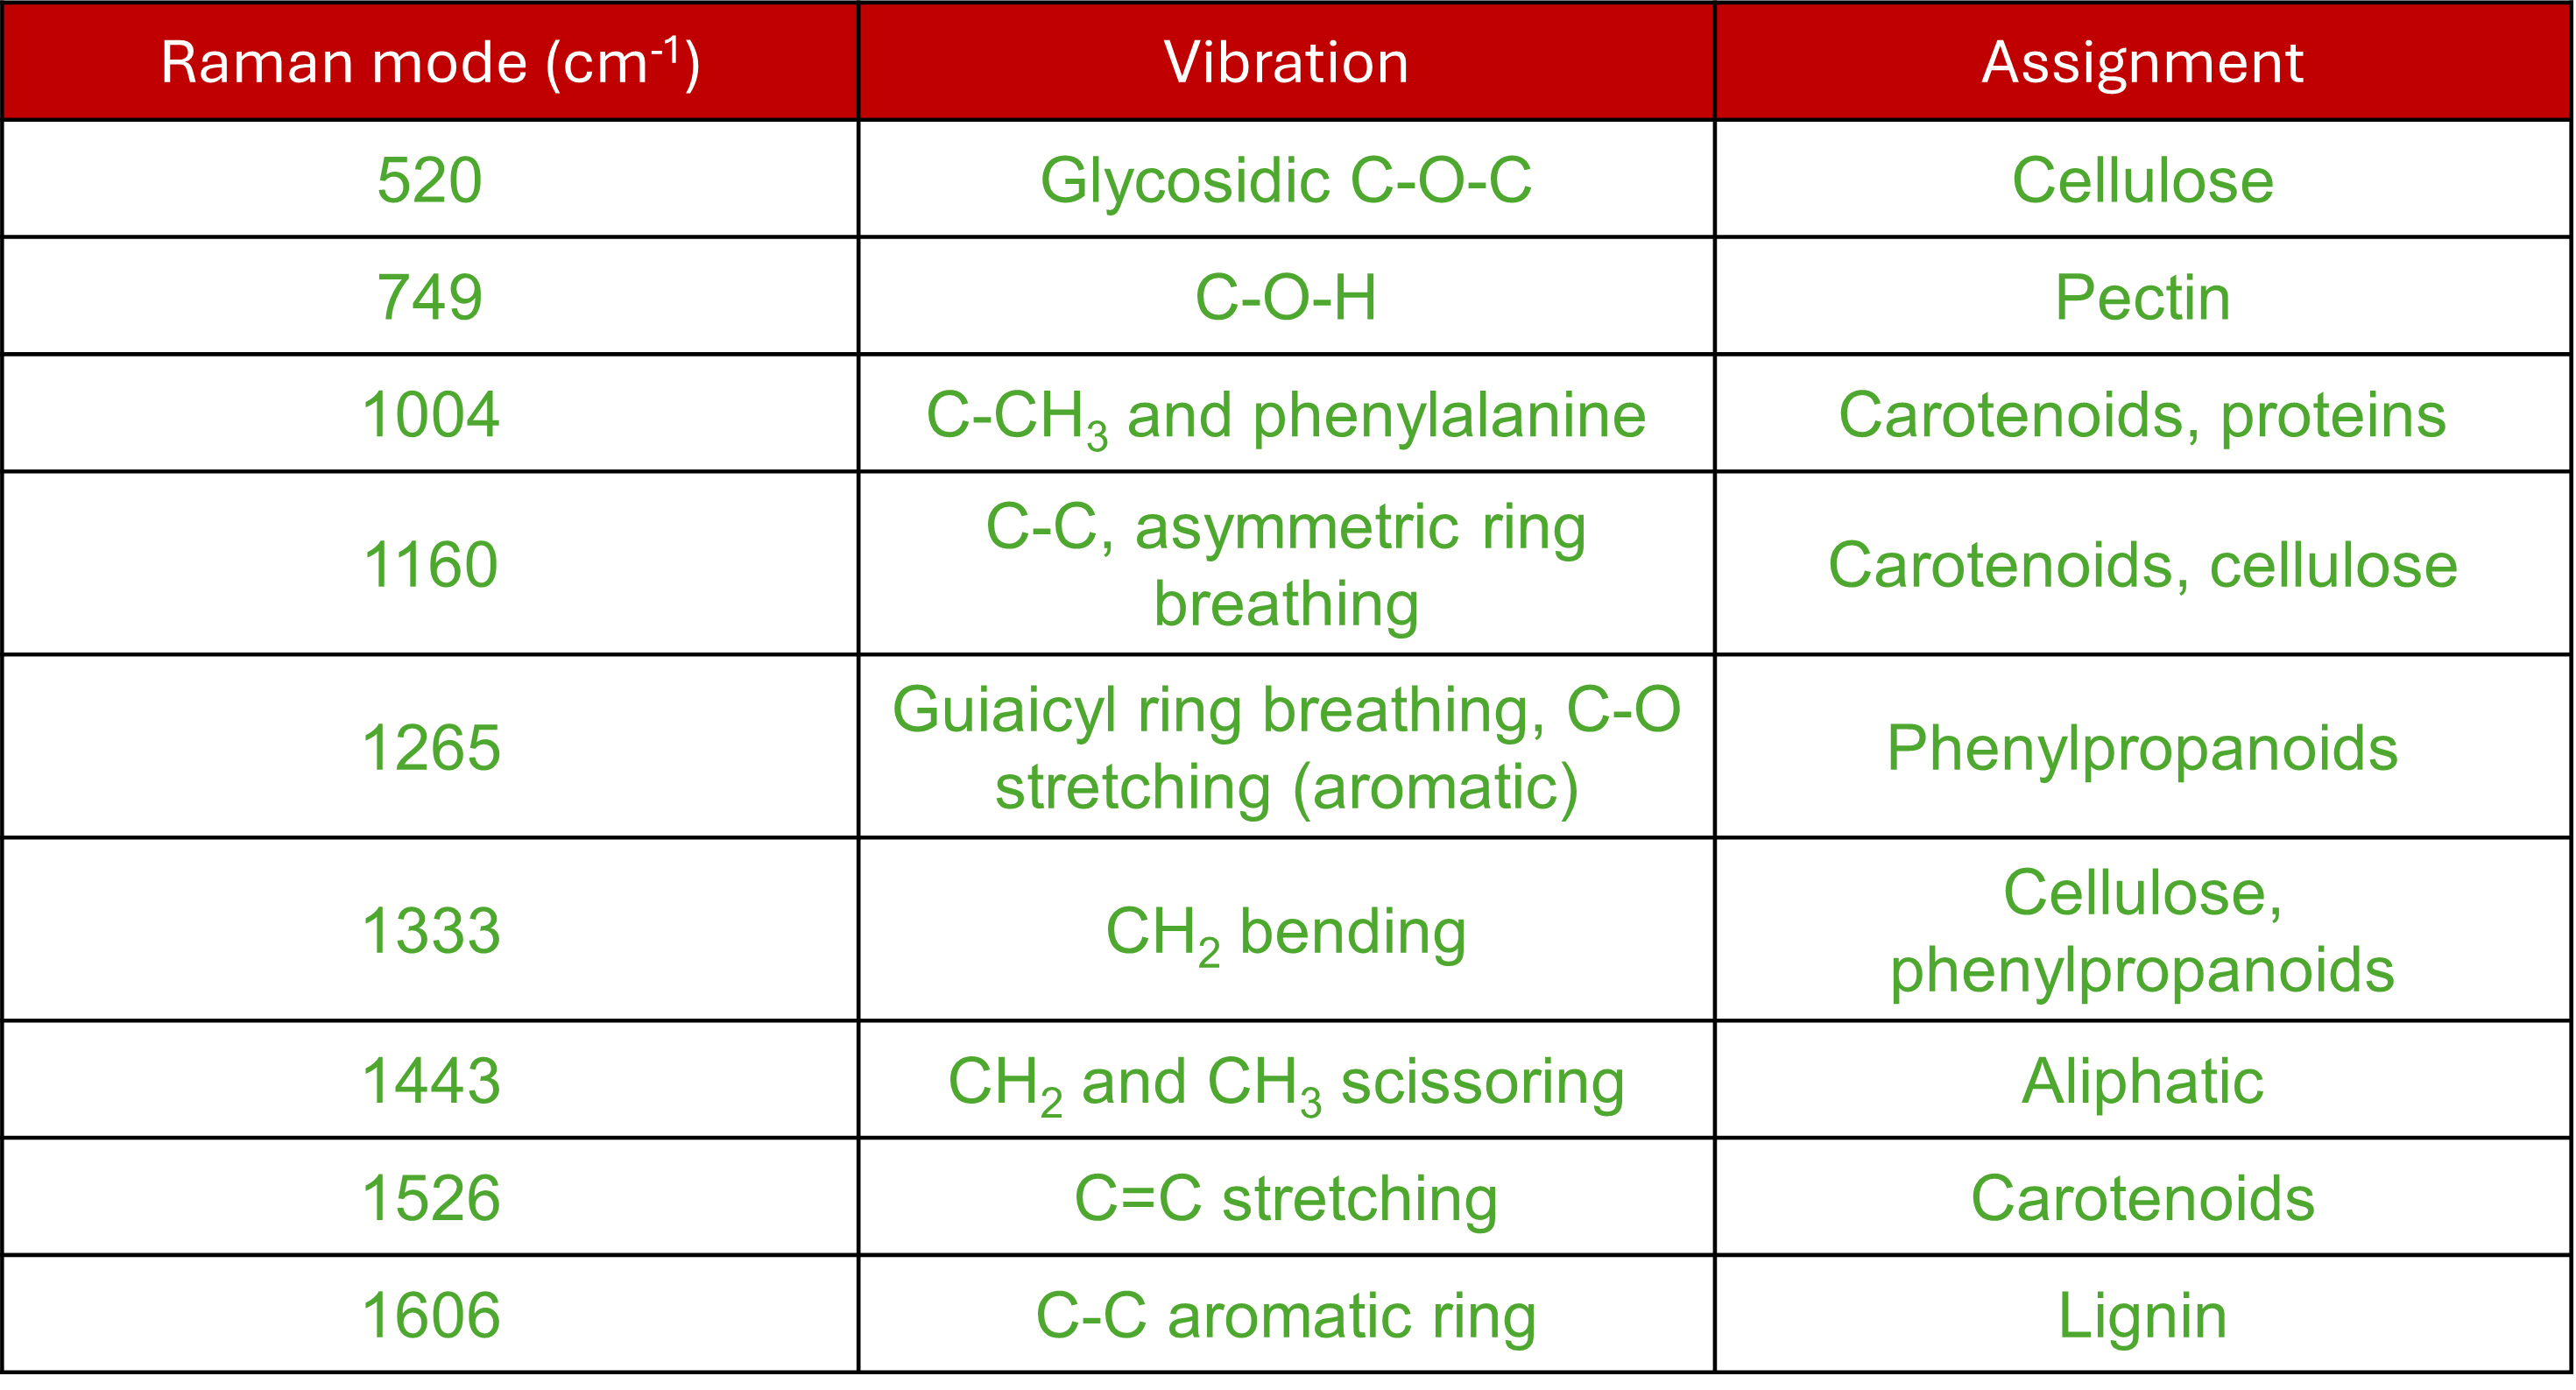
The most dominant features in the Raman spectrum were assigned to carotenoids, which are present in all leaf-bearing plant species. They give rise to the golden colours in plant species that lose chlorophyll in the autumn. Also detected was lignin, a complex and rigid type of polymer that provides structural support and rigidity in the cell walls of plants. The composition of lignins can vary from species to species. We detected the presence of guiaicyl (G) lignin in the Nordmann fir. We also detected the presence of proteins, cellulose, pectin, and phenylpropanoids. The Raman image shows variations in the carotenoid Raman intensity across the needle.
Now for the artificial tree needle. The spectrum from this sample was much more straightforward. It contained peaks from PVC at 636 cm-1 and 690 cm-1, corresponding to the C-Cl stretching region, the primary material constituting artificial trees. Raman is one of the primary techniques for characterising plastics and is already a key technology in the fight against microplastic pollution. The most intense band in the spectrum occurred at 150 cm-1, which was assigned to titanium dioxide, a white pigment commonly used in modern paints. This is most likely the base of the paint used to make the tree look green, i.e., real! The Raman image shows the distribution of the pigment across the artificial needle.
So, there you have it! Raman spectroscopy can help you identify your Christmas tree’s chemical composition and reveal hidden secrets within your samples. We continue to be amazed at the power Raman spectroscopy offers to explore the world around us. As we bid farewell to 2024, we look forward to another year of exciting discoveries and innovative applications of Raman spectroscopy. Stay tuned for more Map of the Month features in 2025.
Happy holidays and a prosperous New Year!