Skip to content
Skip to content
  • News
  • Events
  • eBooks
  • Blog
  • Careers
  • Contact
  • News
  • Events
  • eBooks
  • Blog
  • Careers
  • Contact
KNOWLEDGEBASE
  • About Us
  • Products

    Fluorescence Spectrometers

    • FLS1000 Photoluminescence Spectrometer
    • FS5 Spectrofluorometer
    • LifeSpec II Lifetime Spectrometer
    • Mini-tau Lifetime Spectrometer

    Raman Microscopes

    • RM5 Raman Microscope
    • RMS1000 Multimodal Confocal Microscope

    Transient Absorption

    • LP980 Transient Absorption Spectrometer

    FTIR Spectrometers

    • IR5 FTIR Spectrometer

    Lasers and LEDs

    • Pulsed Lasers
    • Gas Lasers
    • Customisation Options
    View All Products
  • Techniques
  • Applications
KNOWLEDGEBASE
Edit Content
  • About Us
  • Products
  • Techniques
  • Applications
  • Knowledgebase
  • eBooks
  • News
  • Events
  • Blog
  • Careers
  • Contact Us
  1. Home
  2. Blog Post
  3. Map of the Month – Carbon Nanotube Polarisation

BLOG

Map of the Month – Carbon Nanotube Polarisation

  • May 6, 2024

KEY POINTS

  • Mapping can be used to visualise the changes in the Raman spectrum of a sample when an external variable, such as temperature or polarisation angle, is applied. 
  • Mapping is used to reveal the orientation of horizontally aligned carbon nanotubes during an angle-resolved polarised Raman microscopy study.
Edit Content

Welcome to Edinburgh Instruments’ blog celebrating our work in Raman, Photoluminescence, and Fluorescence Lifetime Imaging. Every month, we aim to highlight our pick for Map of the Month to show how our Raman and fluorescence spectrometers can be used to reveal all the hidden secrets in your samples.  

May 

In Raman spectroscopy, mapping is most commonly used to visualise the distribution of different components or the changing properties of a single material across a 2D or 3D space. Another common application of mapping is to visualise the change more clearly in the Raman spectrum of a sample when an external variable is applied to the experiment. 


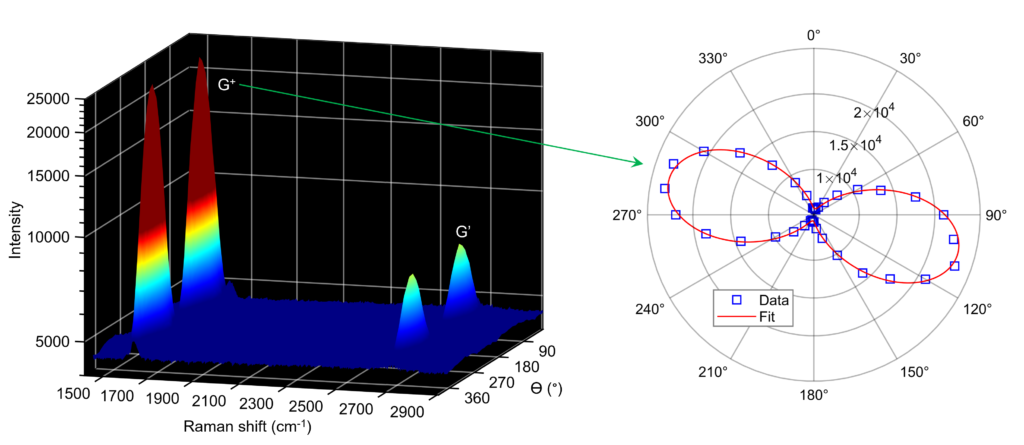
Mapping can be a compelling way to visualise changes in the spectrum over time, with changing temperature, or with alterations in the polarisation angle. In these cases, the X and Y axes of the map are the Raman shift and the external variable, respectively, and false-colour imaging indicates the intensity at each point in the map.  


The images above show different methods for visualising a Raman experiment where the polarisation angle of the optics with respect to a horizontally aligned carbon nanotube sample was iteratively changed. The points of high intensity in the map could be used to reveal the alignment and orientation of the nanotubes because it suggested that the laser polarisation was lined up with the highly polarised longitudinal axis of the sample. Read our recent Application Note to learn about angle-resolved polarisation Raman microscopy works.  

RELATED PRODUCTS

RMS1000

Multimodal Confocal Microscope

VIEW

RM5

Raman Microscope

VIEW

RESOURCES

Tags:
  • Nanocarbon
  • RM5
  • RMS1000
  • Raman
Share:
PrevPrevious
NextNext

Keep up to date with the latest from Edinburgh Instruments

Join our mailing list and keep up with our latest videos, app notes and more!

LOCATION:
  • Edinburgh Instruments Ltd.
    2 Bain Square, Kirkton Campus, Livingston, EH54 7DQ.
  • sales@edinst.com
  • +44 1506 425 300
ABOUT:
  • About Us
  • Techniques
  • Applications
  • Knowledgebase
  • About Us
  • Techniques
  • Applications
  • Knowledgebase
PRODUCTS:
  • Fluorescence Spectrometers
  • Raman Microscopes
  • UV-Vis Spectrophotometers
  • Transient Absorption
  • FTIR Spectrometers
  • Lasers and LEDs
  • Customisation Options
  • Software
  • Upgrades
  • All Products
  • Fluorescence Spectrometers
  • Raman Microscopes
  • UV-Vis Spectrophotometers
  • Transient Absorption
  • FTIR Spectrometers
  • Lasers and LEDs
  • Customisation Options
  • Software
  • Upgrades
  • All Products
LEGALS:
  • News
  • Events
  • Blog
  • Careers
  • Contact Us
  • Terms and Conditions
  • Privacy Policy
  • News
  • Events
  • Blog
  • Careers
  • Contact Us
  • Terms and Conditions
  • Privacy Policy
SOCIALS:
Youtube Linkedin X-twitter Facebook
©2024 Edinburgh Instruments. Registered in England and Wales No: 962331. VAT No: GB 271 7379 37
Manage Consent
To provide the best experiences, we use technologies like cookies to store and/or access device information. Consenting to these technologies will allow us to process data such as browsing behaviour or unique IDs on this site. Not consenting or withdrawing consent, may adversely affect certain features and functions.
Functional Always active
The technical storage or access is strictly necessary for the legitimate purpose of enabling the use of a specific service explicitly requested by the subscriber or user, or for the sole purpose of carrying out the transmission of a communication over an electronic communications network.
Preferences
The technical storage or access is necessary for the legitimate purpose of storing preferences that are not requested by the subscriber or user.
Statistics
The technical storage or access that is used exclusively for statistical purposes. The technical storage or access that is used exclusively for anonymous statistical purposes. Without a subpoena, voluntary compliance on the part of your Internet Service Provider, or additional records from a third party, information stored or retrieved for this purpose alone cannot usually be used to identify you.
Marketing
The technical storage or access is required to create user profiles to send advertising, or to track the user on a website or across several websites for similar marketing purposes.
Manage options Manage services Manage {vendor_count} vendors Read more about these purposes
View preferences
{title} {title} {title}