Welcome to Edinburgh Instruments’ blog celebrating our work in Raman, Photoluminescence, and Fluorescence Lifetime Imaging. Every month, we aim to highlight our pick for Map of the Month to show how our Raman and fluorescence spectrometers can be used to reveal all the hidden secrets in your samples.

Raman spectroscopy has a lot of potential in the field of medical diagnostics. It can be performed rapidly without damaging the sample, and an abundance of information can be obtained from a single scan, which is excellent for multiplexed analysis. The ultimate goal for a Raman-based diagnostic tool is to get automated and accurate medical information that informs clinicians whether a disease state is present or not. For example, it could differentiate between malignant and benign tumour tissue or different pathogenic strains in an infection. Both are crucial for prompt and effective treatment.

Often, Raman spectra from different biological groups are highly similar, and differences are challenging to detect by eye. At a larger scale, it would be extremely painstaking to sift through hundreds or thousands of spectra to notice patterns between healthy and diseased tissue or different infectious pathogens. With this in mind, many researchers are working on coupling Raman spectroscopy with techniques that make data interpretation of biological samples easier, which can be used in machine learning models.
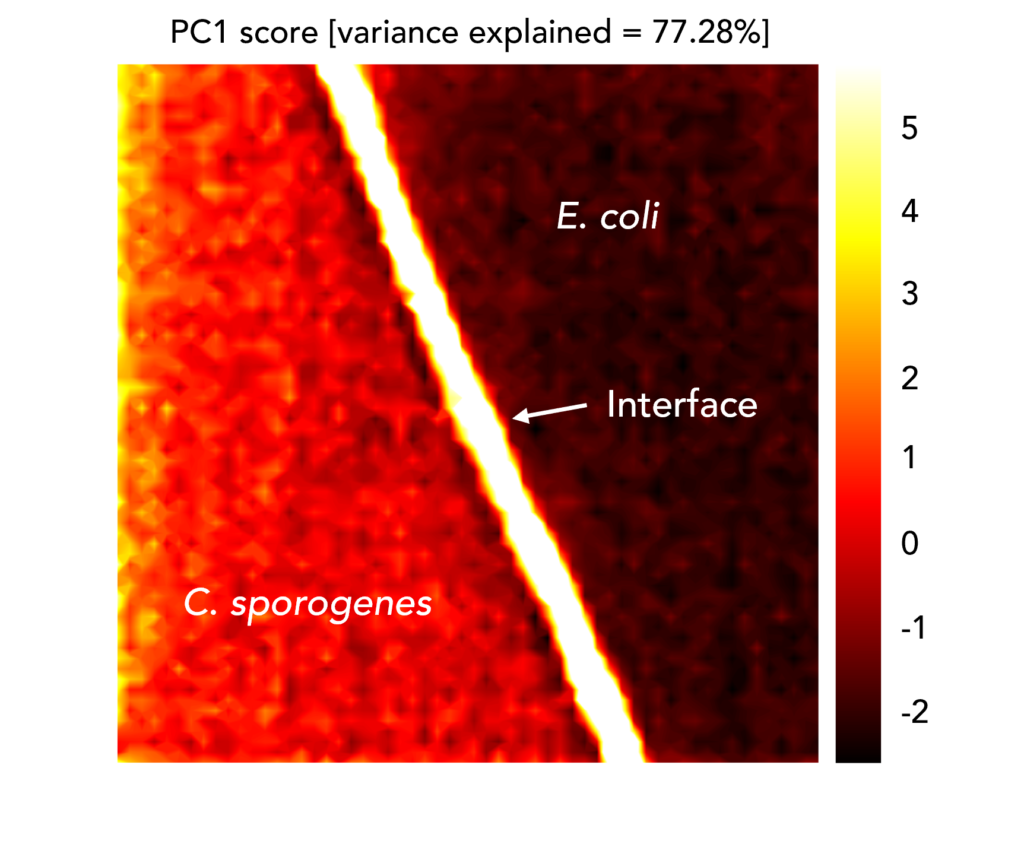
One such technique is principal component analysis (PCA), which reduces the number of variables in the dataset without sacrificing information. A Raman spectrum contains thousands of variables: each wavenumber in a spectrum has an intensity, which is a variable. Analysis of a spectral dataset by eye for diagnostic purposes would require considering the variation between intensities at each wavenumber: a huge task! Instead, PCA outputs a handful of Principal Components, new variables that describe the variability within the dataset, for which each spectrum has a score. The scores explain how similar different spectra are, and they can be used to build Raman maps of samples.
In the example above, we mapped an area on a sample where two bacterial colonies intersected. The spectra for both species were very similar, and it was difficult to discriminate them by eye. However, when we performed PCA analysis on the dataset and plotted the image of the first Principal Component, we saw that the two species could be differentiated based on their different scores and false-colouring on the map. The interface between them, which contained bacterial cells from both species, was also distinct.
If you have found this blog interesting, why not read our recent Application Note? In it, we detail how PCA works and how it can be used to differentiate between different pathogenic microorganisms.