The FLS1000 Photoluminescence Spectrometer can be equipped with up to 5 different detectors (8 if two emission monochromators are present), and there is a wide range to choose from including analogue, high-speed detectors or NIR-sensitive photomultiplier tubes (PMTs). In this blog post we help you to select the best photomultiplier detector for your application, either when you first buy an instrument or when you are considering an upgrade. There are a few basic questions that need to be considered in order to choose a detector:
The most basic requirement is that the detector must be sensitive over the whole emission range of the sample to acquire the full spectrum. Below is a summary of the spectral ranges covered by Edinburgh Instruments detectors. The PMT-900 is the standard visible photomultiplier for the FLS1000, but it can be swapped by the PMT-980 option for sensitivity up to 980 nm. High speed detectors (more information on these below) cover the visible range only, whereas the mid-infrared range is covered by analogue detectors. Photon-counting NIR PMTs exist in liquid nitrogen or TE-cooled versions with a spectral range up to 1650 nm.

The graph above is useful but oversimplified: the sensitivity of the detector follows a curve along its spectral range and is typically lower at the edges. In addition, the sensitivity of the instrument is affected by the grating used in combination with the detector. As seen in our previous blog post, the efficiency of a grating depends on the wavelength and this affects significantly the spectral response curve of the system. Edinburgh Instruments will advise on the best gratings to match the detector’s spectral range, but the instrument can be configured with non-standard gratings if you are interested in a particular spectral region.
The emission quantum yield of a sample can determine the type of detector to be used. Detectors in the FLS1000 can be classified as analogue (lower sensitivity) and photon counting (higher sensitivity). In most cases the detectors are cooled as standard which reduces their dark counts improving the signal-to-noise ratio.
The photomultiplier tube detectors are operated in photon-counting mode, where the dark counts and noise from voltage fluctuations are eliminated by the electronics. This results in a very high signal-to-noise ratio enabling the detection of weak fluorescence signals. Some models of photon counting detector such as the PMT-1400 and PMT-1700 have higher dark counts which lowers their sensitivity, but they still perform better than an analogue detector.
Analogue detectors do not detect individual photons and their signal-to-noise ratio is much lower; however they are the only commercially available solution at wavelengths above 1650 nm. Edinburgh Instruments improves the signal to noise ratio of its InGaAs, InAs and InSb analogue detectors with the help of a lock-in amplifier, which enhances the signal detected.
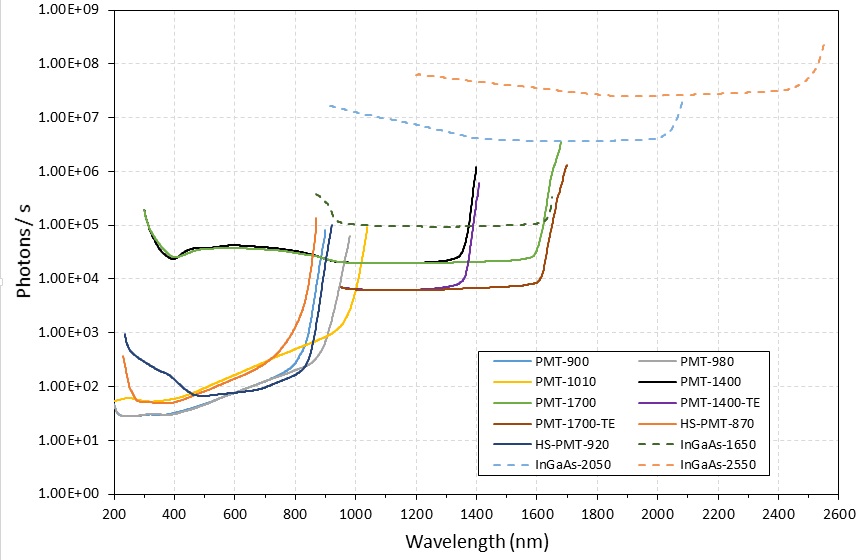
Figure 1 below shows the number of photons per second that must reach a detector in order to obtain a signal-to-noise ratio of 1, which helps comparing the sensitivity of different detectors. The curves are calculated as a function of wavelength using different formulas for photon-counting and analogue detectors:

In the equation above the first expression is used for photon-counting detectors such as PMTs and the second expression is used for analogue detectors (NEP is the noise-equivalent power at a specified wavelength). The quantum efficiency of the detector is the ratio between incident photons and electrons produced by the detector, which depends strongly on the photon’s wavelength.
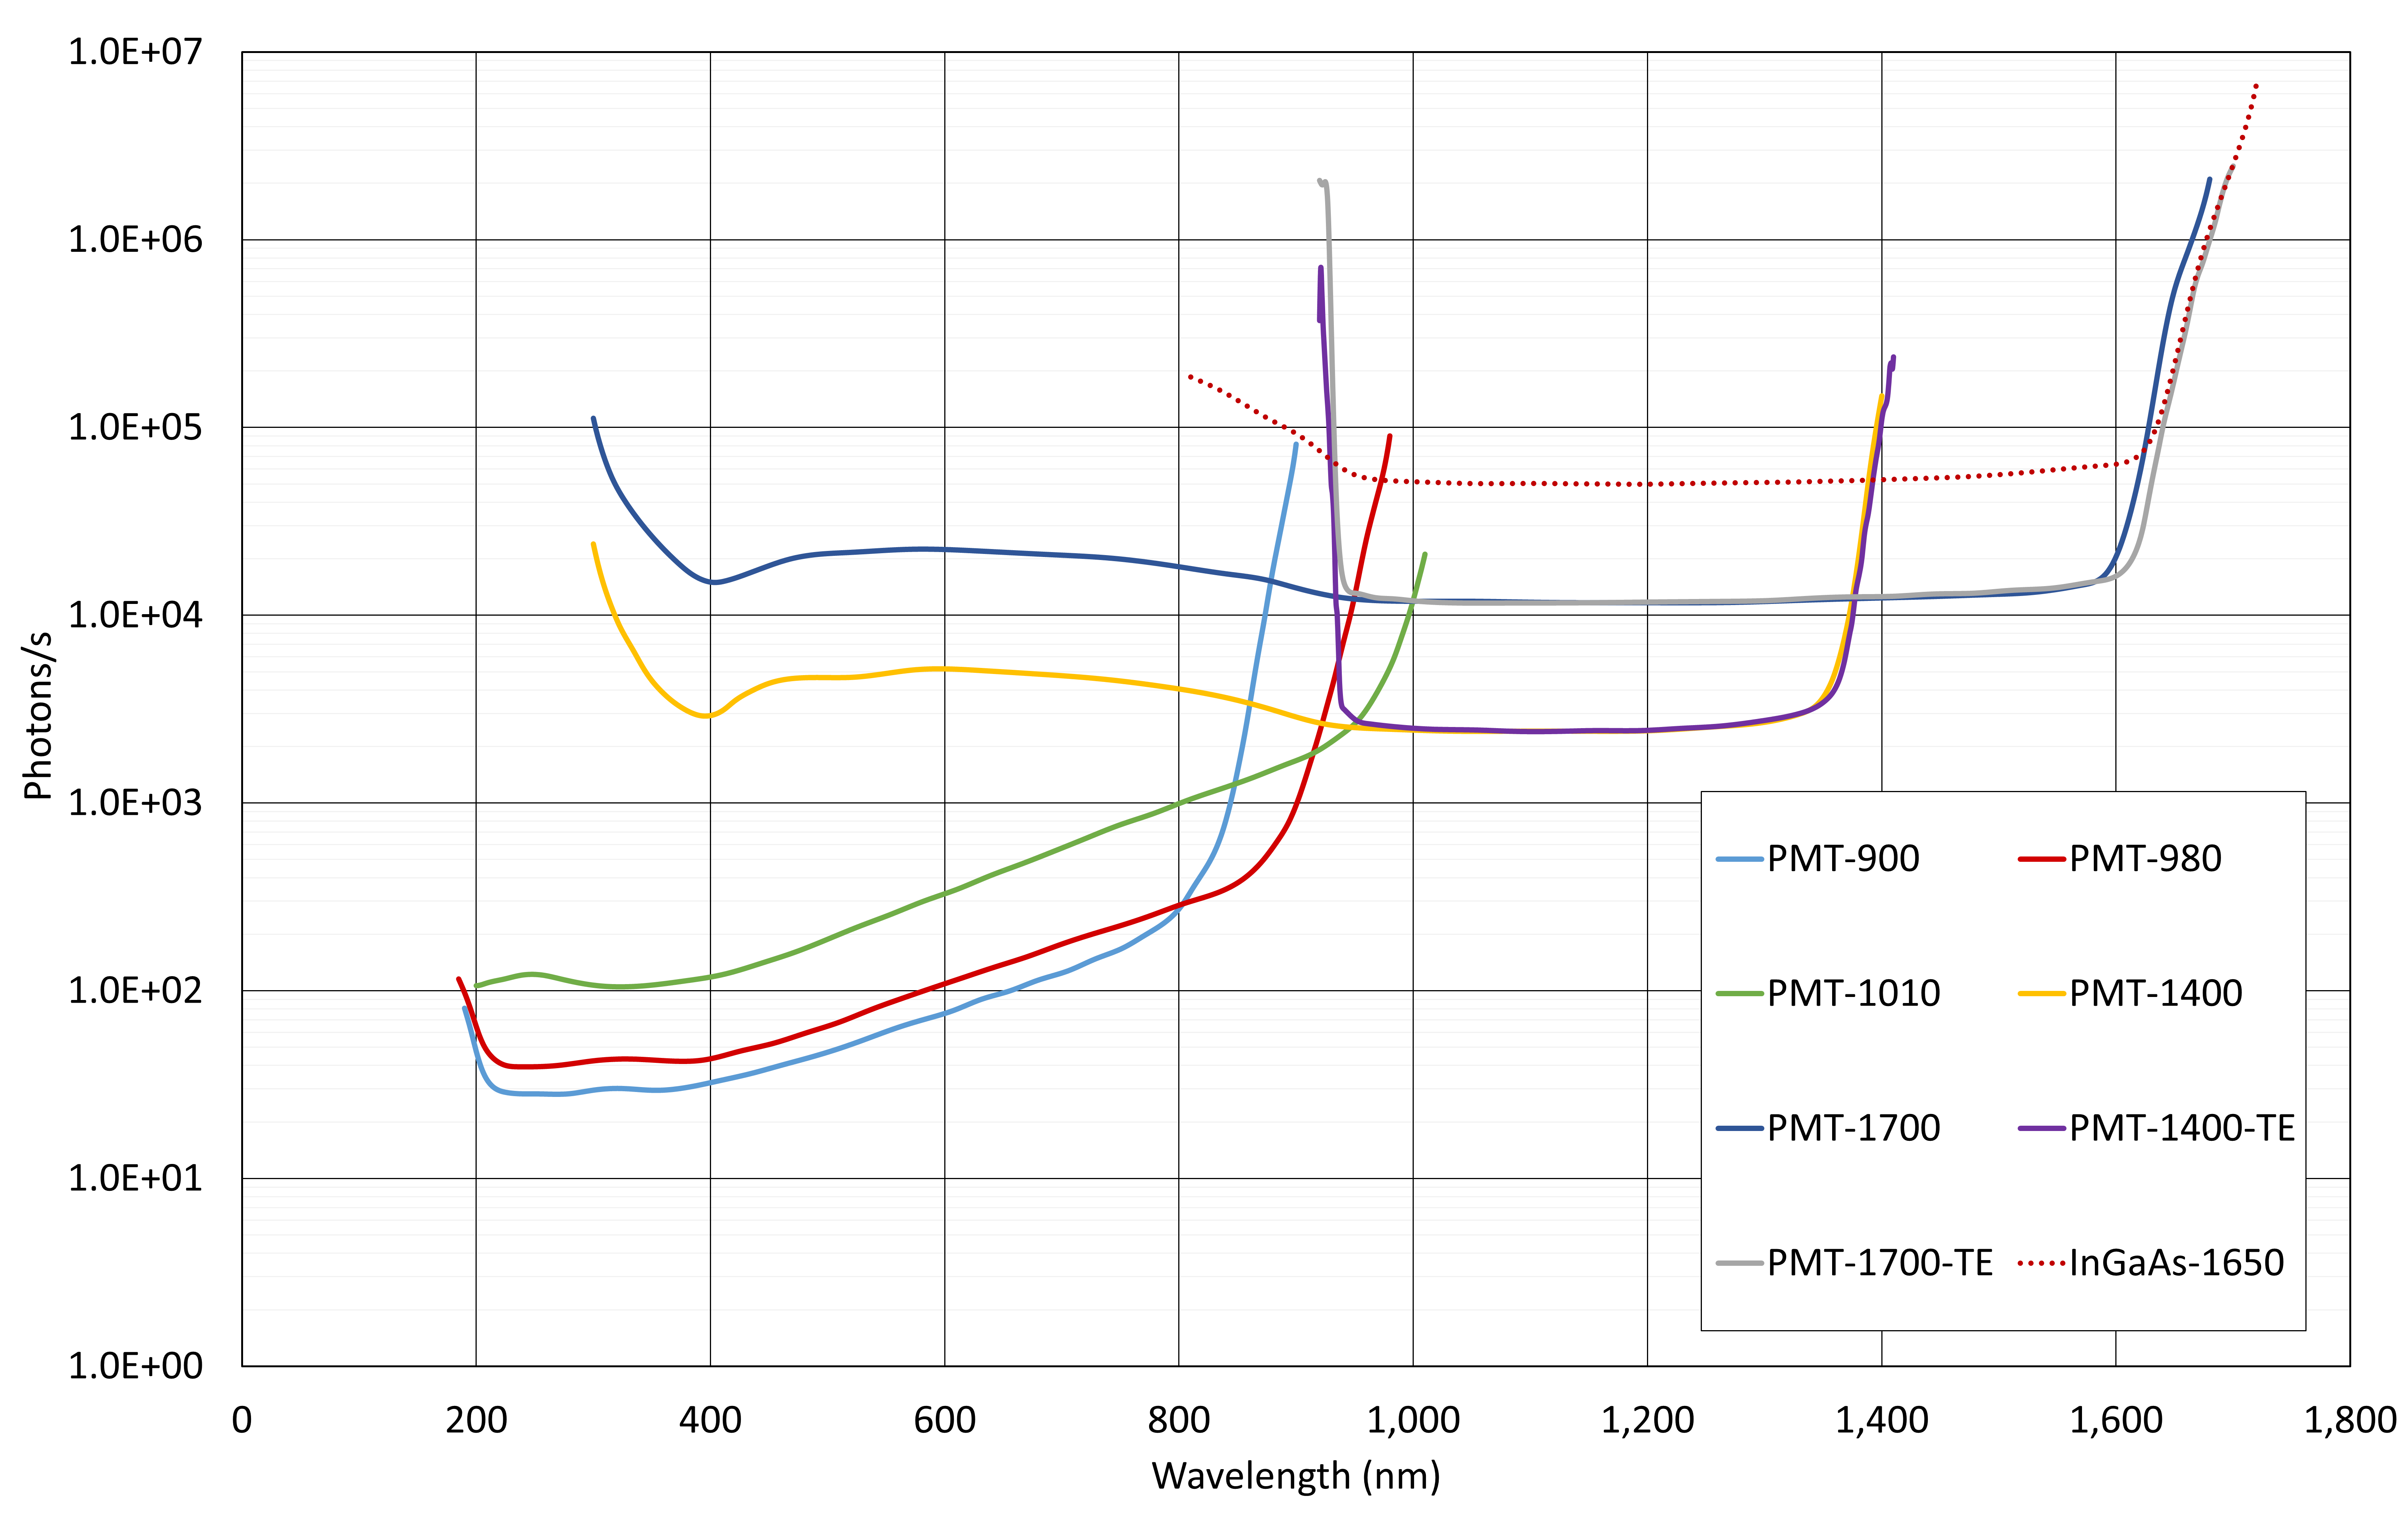
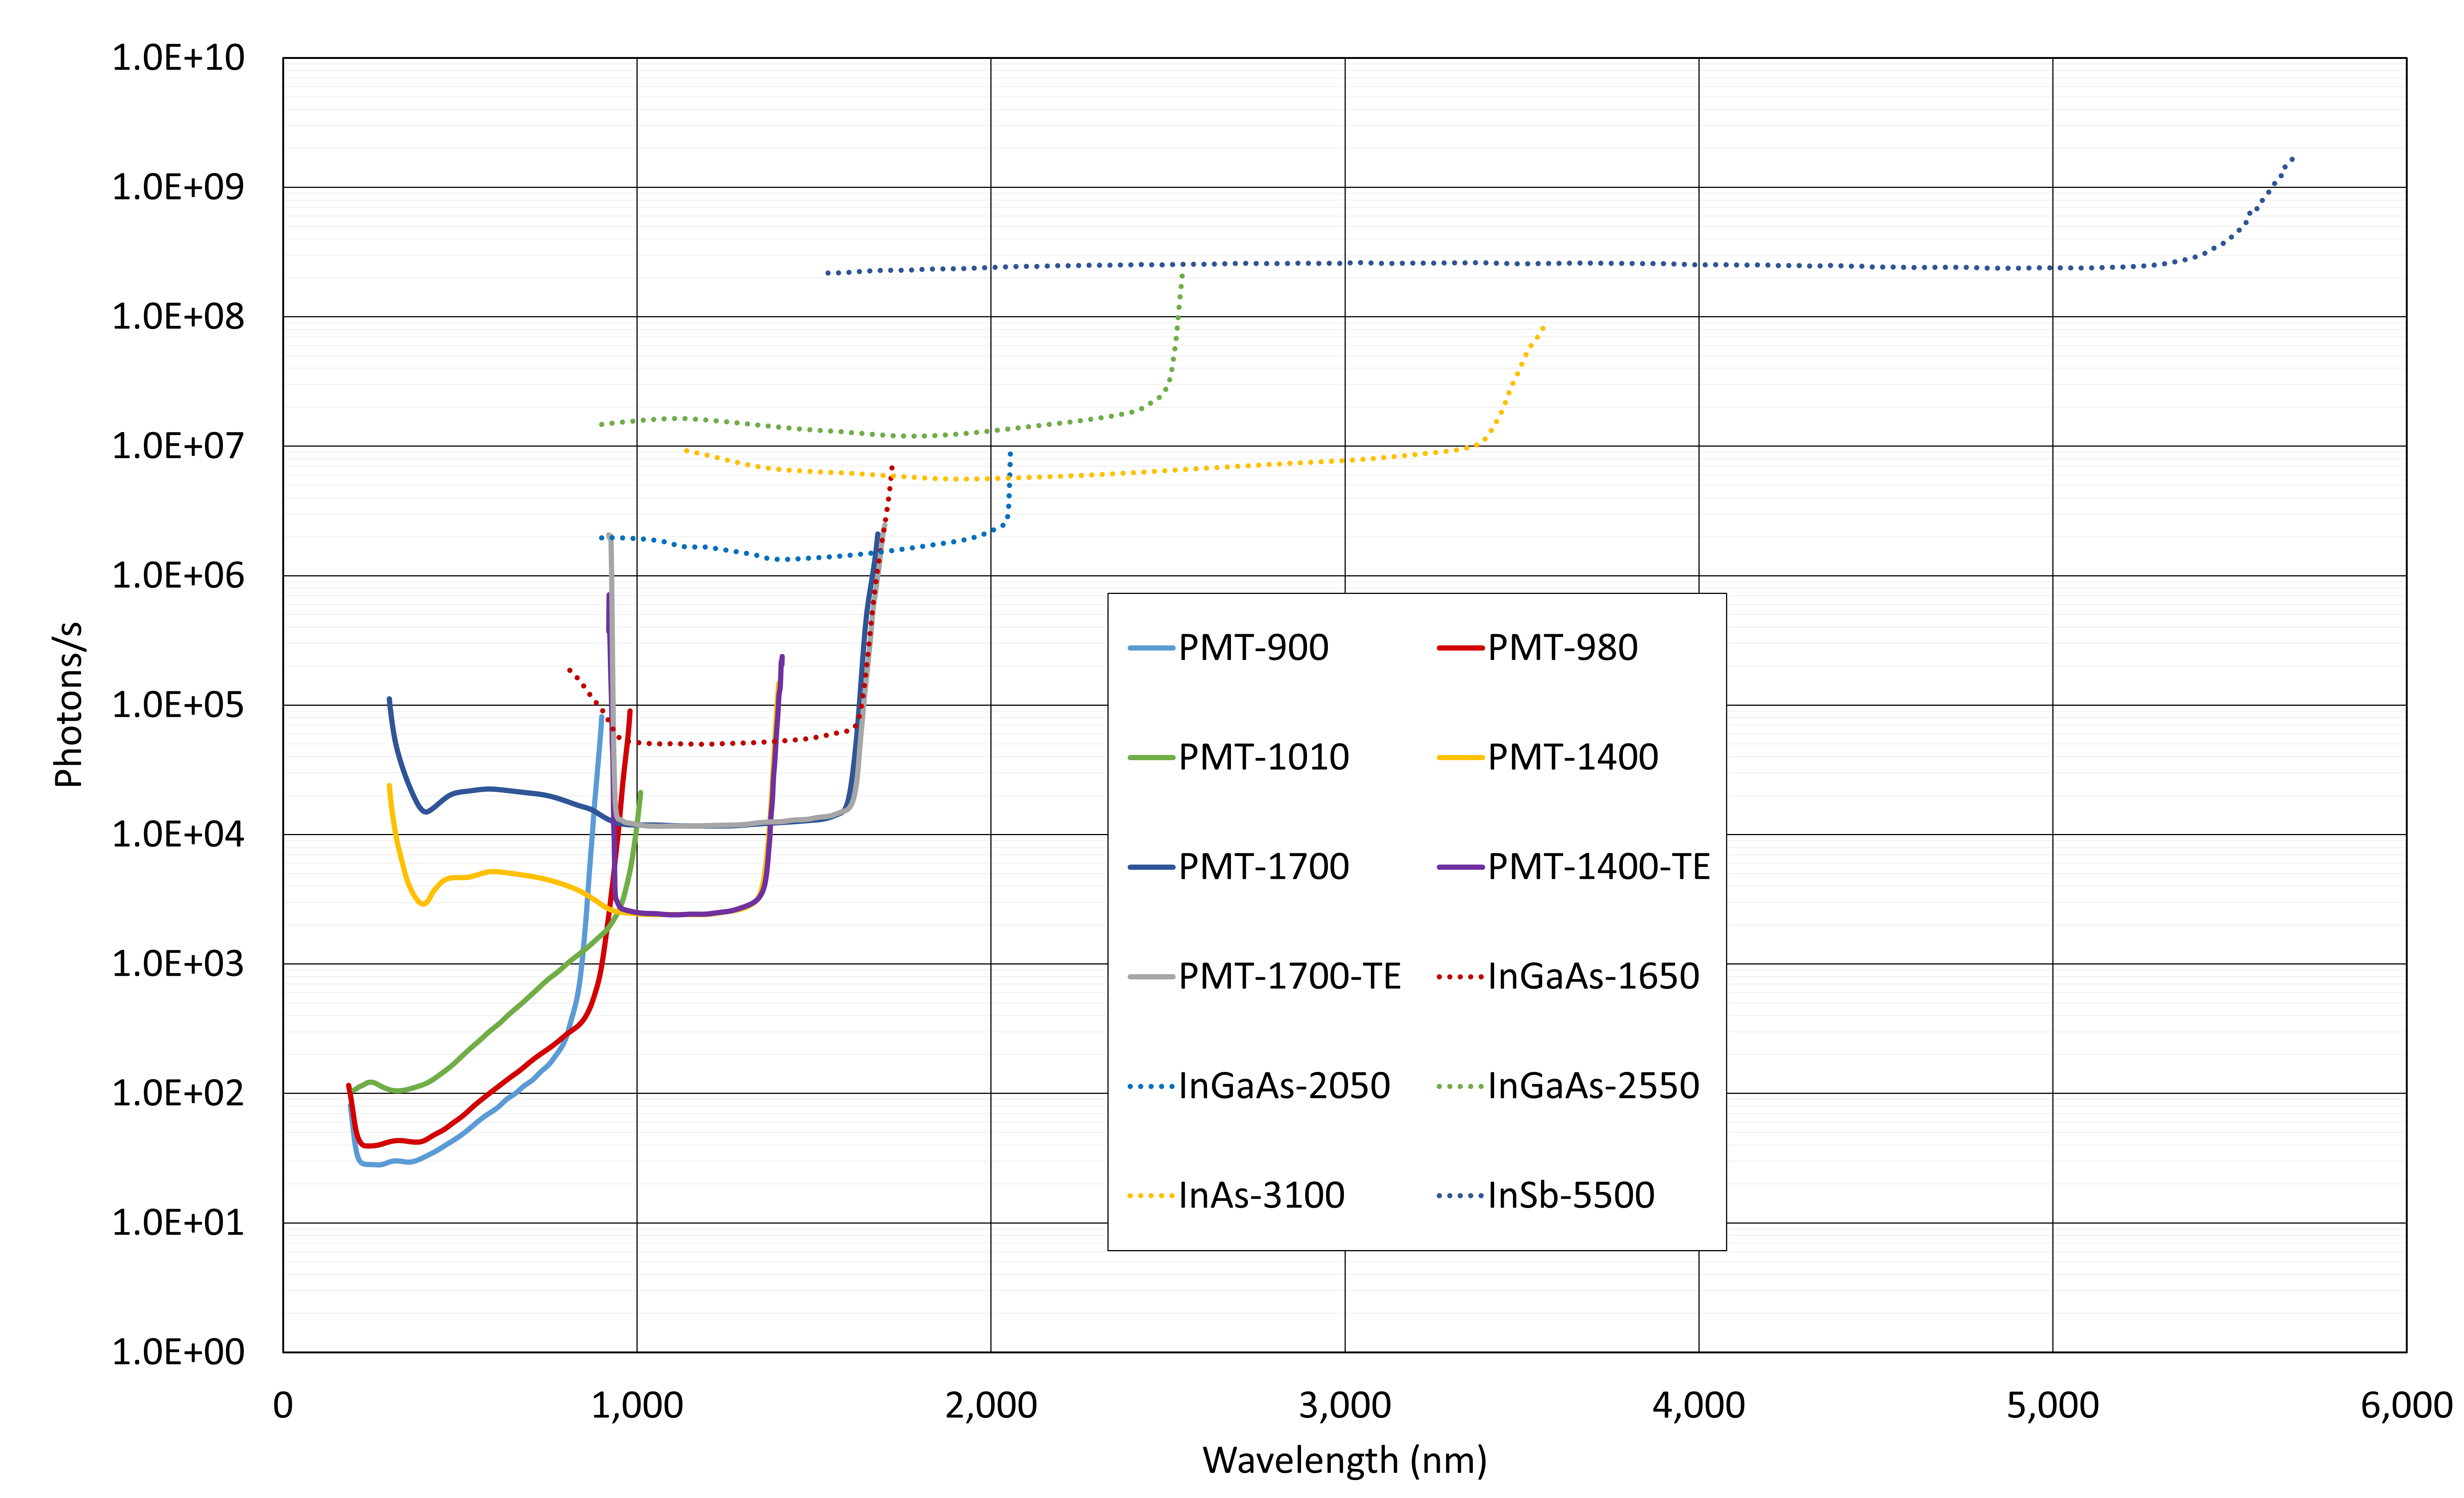
Figure 1. Photons/s for a signal-to-noise ratio of 1. FLS1000 detector options up to 1,700 nm (top) and 5,500 nm (bottom).
It can be seen in the graphs that the difference between PMT-900 and the analogue detectors can be up to 6 orders of magnitude, something to take into account when measuring weakly emitting samples. It is therefore important to choose suitable sources in combination with your detectors, for example CW lasers in combination with mid-IR analogue detectors. Edinburgh Instruments can advise on the best source and detector combination for your application.
If you are planning to perform photoluminescence quantum yield (PLQY) measurements, you will need an instrument that covers both the absorption and emission regions of the PLQY measurements. Ideally, absorption and emission should be measured with the same detector but it is also possible to use two separate detectors. If two detectors are used, there needs to be a region of spectral overlap between them. For example, if your samples absorb at 500 nm and emit at 1200 nm – 1300 nm you may use a PMT-980 detector for the absorption region and an InGaAs-1650 for the emission. It would not be possible to perform this PLQY measurement using a PMT-900 and InGaAs-1650 as there is no region of overlap between these two detectors.
The table below shows which visible and NIR detector combinations can be used for PLQY measurements, and the region of spectral overlap between detectors.
| Detector | PMT-1400-TE | PMT-1400-TE | PMT-1700 | PMT-1700-TE | InGaAs-1650 | InGaAs-2050 | InGaAs-2550 |
|---|---|---|---|---|---|---|---|
| PMT-900 | 500 nm – 870 nm | x | 500 nm – 870 nm | x | x | x | x |
| PMT-980 | 500 nm – 980 nm | x | 500 nm – 980 nm | x | 870 nm – 980 nm | 900 nm – 980 nm | 900 nm – 980 nm |
| PMT-1010 | 500 nm – 1010 nm | 950 nm – 1010 nm | 950 nm – 1010 nm | 950 nm – 1010 nm | 870 nm – 1010 nm | 900 nm – 1010 nm | 900 nm – 1010 nm |
If you are planning time-resolved photoluminescence (PL) measurements, the time response of the detector is another crucial parameter to consider. The range of PL lifetimes that you expect to measure will determine the best detector for your application.
The shortest lifetime that can be measured in a photoluminescence spectrometer depends on the Instrument Response Function (IRF), which is a measure of the temporal response of the instrument. The IRF in turns depends on several factors: the pulse width of the source, the temporal response of the detector, and the jitter in the electronics:

If using a photomultiplier detector, FWHMdetector is the transit time spread (TTS). The transit time is a measure of how long it takes an electron to travel from the photocathode to the anode, and the TTS is the full width half maximum of the transit time distribution. The standard PMT-900 detector from Edinburgh offers a TTS value of 600 ps, but there are other options such as high speed detectors with 180 ps response, or MCP-PMTs with 25 ps response.
The minimum measurable lifetime depends on FWHMIRF as follows:

However, the equation above does not take into account the dark count rate of the detector, which limits τmax in Time-Correlated Single Photon Counting (TCSPC) measurements. At high dark counts, the tail of the PL decay will be masked by the baseline of the measurement. As a rule of thumb, we advise a maximum dark count of 5% of the frequency of the light source. If this rule is followed, τmax may be expressed as:
As an example, an NIR-PMT with a dark count rate of 50,000 counts/second should be used with a source repetition rate > 1 MHz. This results in a value of τmax = 100 ns.
For more information on the theory and operation of fluorescence spectrometers, why not take a look at the frequency asked questions section on our blog.
If you have found this article on selecting the best photomultiplier detector for your application, why not sign-up to our monthly newsletter and join us on social media to be the first to hear about our latest news and applications. Or to get in touch with a member of our team, please do not hesitate to contact us – we look forward to hearing from you.