When fluorescence spectra are measured in Edinburgh Instruments fluorescence spectrometers, two types of correction can be applied to the spectra; excitation and emission. In our previous Spectral School tutorial, we focused on emission correction and its role in the detection system. Now we turn our attention to excitation correction. Fluorescence spectrometers use xenon arc lamps as the excitation source for spectral measurements due to their high brightness and broad spectral range. Excitation correction is used to account for spectral and temporal variations in the intensity of the xenon arc lamp when measuring fluorescence excitation and emission spectra.
When measuring fluorescence excitation spectra, the emission monochromator is set at a wavelength of known fluorescence and the excitation monochromator is scanned across the desired excitation wavelength range. This yields a fluorescence excitation spectrum which is essentially the fluorescence detected absorption spectrum of the sample. Since the emission wavelength is constant the spectral response of emission monochromator and detector does not influence the spectrum and emission correction is therefore not required. Instead, it is the variation in the intensity of excitation light with wavelength that must be accounted for.
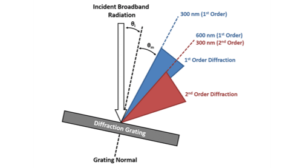
The spectral output of the xenon arc lamp is a 6000 K blackbody spectrum with additional pronounced spikes due to the atomic transitions of xenon. This light is then wavelength selected inside the excitation monochromator which will introduce additional wavelength variation due to the wavelength dependent efficiency of the diffraction gratings and optics. The spectral profile of the excitation light immediately after the monochromator is shown in Figure 1.

Figure 1: The spectral profile of the excitation light intensity monitored using the silicon reference detector.
If this variation in intensity with wavelength is not accounted for then a fluorescence excitation spectrum will be a convolution of the changes in sample absorbance and the spectral profile of the excitation light. To account for this variation, Edinburgh Instruments spectrometers incorporate a silicon reference detector located just after the excitation monochromator and before the sample. A small fraction of the incoming excitation light is tapped off and the intensity monitored using the reference detector.
When excitation correction is applied, the signal from the emission detector is divided by the excitation intensity measured on the reference detector in order to remove the influence of the excitation intensity from the measured signal (Eq. 1).

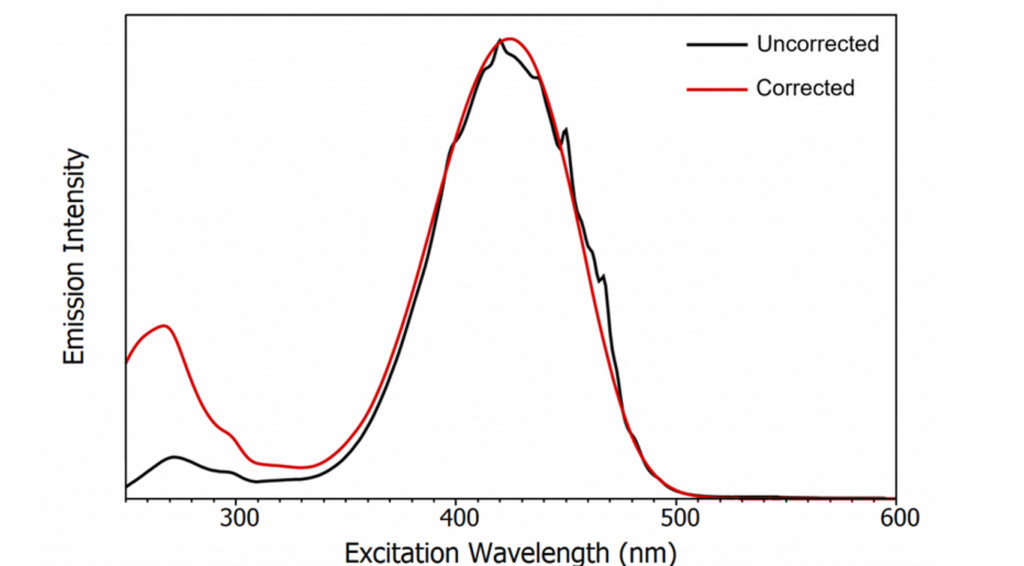
To demonstrate the impact of excitation correction; the fluorescence excitation spectrum of Coumarin 153 was measured with and without excitation correction as shown in Figure 2 alongside the excitation intensity measured on the reference detector during the measurement. It can be seen that the uncorrected spectrum has artefacts in the 400 nm – 500 nm region due to the atomic transitions of xenon. Measuring the spectrum with excitation correction enabled removes these artefacts and also enhances the relative intensity of the low wavelength absorption band to give the true fluorescence detected absorption spectrum of Coumarin 153.


Figure 2: (a) Fluorescence excitation spectrum of Coumarin 153 with and without excitation correction. (b) The excitation intensity measured using the reference detector.
Excitation correction can also be applied when measuring fluorescence emission spectra. This has a much less pronounced effect than for excitation spectra but can be useful in some circumstances. The main purpose of excitation correction for emission spectra is to account for any temporal variations in the output of the xenon lamp during the measurement.
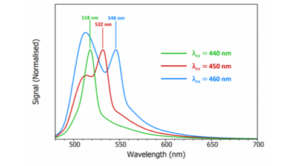
The principle of this is shown in Figure 3, which shows the fluorescence emission spectrum of Coumarin 153 with both emission and excitation correction applied, alongside the fluctuation in the excitation intensity recorded on the reference detector. This was a quick measurement and the fluctuation in excitation intensity is no more than 0.2% over the course of the measurement and applying excitation correction will, therefore, have very little influence on the shape of the spectrum in this instance. However, for more time-consuming measurements such as the long averaging of a weakly emitting sample then excitation correction can be used to remove any drifts in the excitation intensity that occur. It can also be used when monitoring physical and chemical changes of a sample over time, by intermittently recording emission spectra over a period of hours or days for example. Applying excitation correction will ensure that any changes in the intensity of the emission spectrum are due to sample changes and not differing excitation intensities.


Figure 3: (a) Fluorescence emission spectrum of Coumarin 153 with excitation correction and emission correction applied. (b) The excitation intensity measured using the reference detector.
For more information on the theory and operation of fluorescence spectrometers, check out the frequency asked questions section on our blog.
If you have enjoyed this article, please sign-up to our monthly newsletter and join us on social media to be the first to hear about our latest news and applications. Or to get in touch with a member of our team, please do not hesitate to contact us – we look forward to hearing from you.