Skip to content
Skip to content
  • News
  • Events
  • eBooks
  • Blog
  • Careers
  • Contact
  • News
  • Events
  • eBooks
  • Blog
  • Careers
  • Contact
KNOWLEDGEBASE
  • About Us
  • Products

    Fluorescence Spectrometers

    • FLS1000 Photoluminescence Spectrometer
    • FS5 Spectrofluorometer
    • LifeSpec II Lifetime Spectrometer
    • Mini-tau Lifetime Spectrometer

    Raman Microscopes

    • RM5 Raman Microscope
    • RMS1000 Multimodal Confocal Microscope

    Transient Absorption

    • LP980 Transient Absorption Spectrometer

    FTIR Spectrometers

    • IR5 FTIR Spectrometer

    Lasers and LEDs

    • Pulsed Lasers
    • Gas Lasers
    • Customisation Options
    View All Products
  • Techniques
  • Applications
KNOWLEDGEBASE
Edit Content
  • About Us
  • Products
  • Techniques
  • Applications
  • Knowledgebase
  • eBooks
  • News
  • Events
  • Blog
  • Careers
  • Contact Us

RESOURCES

What is FLIM – Fluorescence Lifetime Imaging Microscopy?

  • August 21, 2023

KEY POINTS

  • Fluorescence lifetime imaging microscopy (FLIM) measures the variation in fluorescence lifetime across a sample 
  • FLIM images are recorded using a pulsed laser source and time-correlated single photon counting (TCSPC) electronics coupled to a confocal microscope 
  • Fluorescence lifetime provides an additional dimension of information not available with conventional fluorescence intensity imaging 
Edit Content

Why use FLIM? 

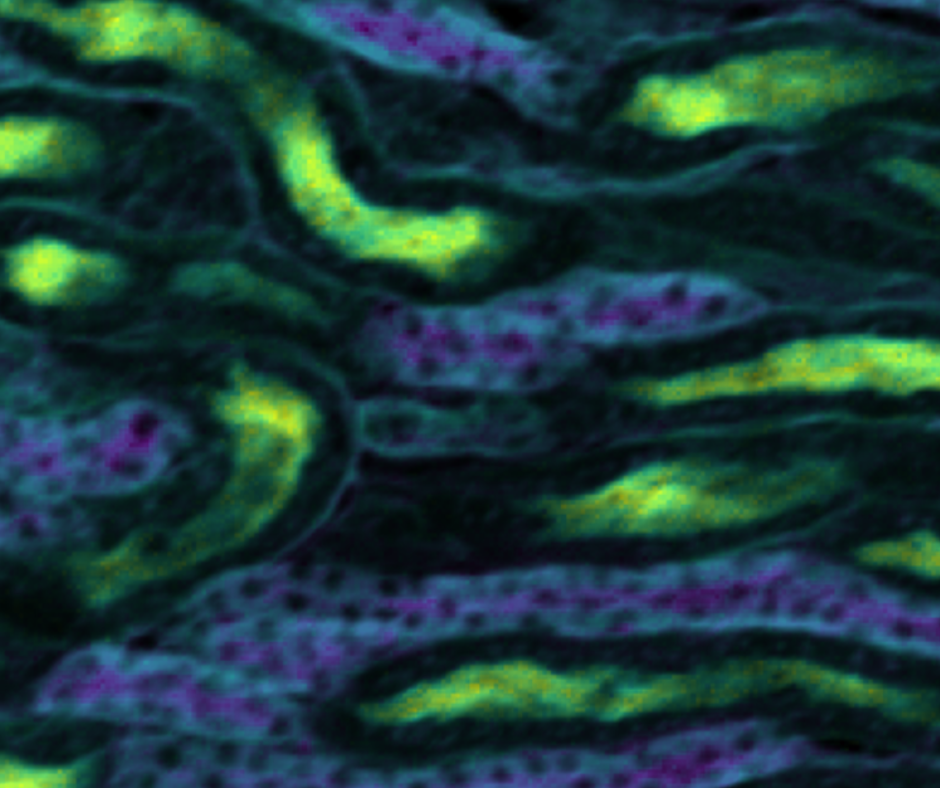
Fluorescence lifetime imaging microscopy (FLIM) is an imaging technique where the fluorescence lifetime variation across the sample creates the contrast in the image (Figure 1). FLIM is widely used in biomedical imaging, where tissue and cells are stained with one or more fluorescent dyes. The dyes’ fluorescence lifetime depends on the local micro-environment, and FLIM provides an additional dimension of environmental information over other imaging techniques such as widefield fluorescence. FLIM is also increasingly used to study intrinsically fluorescent (photoluminescent) materials such as imaging the variation in carrier lifetime of nanomaterials, solar cells, and semiconductors. 

FLIM Images measured using RMS1000 Figure 1: FLIM images of (a) mouse intestine section and (b) mouse kidney section measured using the Edinburgh Instruments RMS1000 Confocal Microscope.

FLIM Confocal Microscope 

FLIM images are acquired using a confocal microscope arrangement (Figure 2). The microscope is equipped with a pulsed laser excitation source and the laser light is focused by the objective lens to a small spot on the sample. The fluorescence from the sample is wavelength selected using either a filter or a monochromator (Figure 2 arrangement) and detected using a single photon counting detector such as a photomultiplier tube (PMT). 

FLIM confocal microscope schematic

Figure 2: FLIM Confocal Microscope. 

FLIM Acquisition 

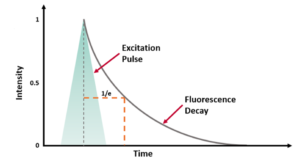
Fluorescence decays are acquired using time-correlated single photon counting (TCSPC).  In TCSPC a pulsed laser is used to excite the sample and the time between the laser pulse and the detected fluorescence photon is measured (Figure 3a).  This process is repeated millions of times to create a histogram of fluorescence photon counts versus arrival time (Figure 3b). 

The area of interest on the sample is split into pixels and the fluorescence decay from each pixel is recorded using TCSPC (Figure 3c). The laser spot is directed onto each pixel by moving the microscope stage (stage scanning) or the excitation laser spot (laser scanning). This process occurs sequentially, with the decay from each pixel recorded in turn to build a dataset of histograms pixel by pixel.   

 FLIM Acquisition diagram

Figure 3: a) Fluorescence photon arrival times are recorded photon by photon using TCSPC. b) Fluorescence decay histogram from a single pixel. c) Fluorescence decay histograms are recorded pixel by pixel across the area of interest.  

FLIM Analysis 

The fluorescence lifetime of each fluorescence decay histogram in the dataset is calculated. This is most often calculated by least squares fitting a single exponential model to each decay to obtain the fluorescence lifetime τ (Figure 4). The range of fluorescence lifetimes obtained from the fitting is mapped onto a colour map to create a colour-coded fluorescence lifetime image. 

FLIM Analysis diagram- What is FLIM?

Figure 4: The fluorescence lifetime of each pixel in the FLIM dataset is calculated and colour mapped to create a colour-coded fluorescence lifetime image.  

RELATED PRODUCTS

MicroPL

Spectromicroscopy Upgrade

VIEW

RMS1000

Multimodal Confocal Microscope

VIEW

EPL Series

Pulsed Lasers

VIEW

Contact our expert team today to find out more about how our products can improve your research

Contact Us
PrevPrevious
NextNext
Previous Time Correlated Single Photon Counting – Why use TCSPC for Fluorescence Lifetime Measurements? Next Detection of Singlet Oxygen by Photoluminescence Spectroscopy

RESOURCES

Tags:
  • Spectral School
  • FLS1000
  • FS5
  • RMS1000
  • Photoluminescence
Share:

Keep up to date with the latest from Edinburgh Instruments

Join our mailing list and keep up with our latest videos, app notes and more!

LOCATION:
  • Edinburgh Instruments Ltd.
    2 Bain Square, Kirkton Campus, Livingston, EH54 7DQ.
  • sales@edinst.com
  • +44 1506 425 300
ABOUT:
  • About Us
  • Techniques
  • Applications
  • Knowledgebase
  • About Us
  • Techniques
  • Applications
  • Knowledgebase
PRODUCTS:
  • Fluorescence Spectrometers
  • Raman Microscopes
  • UV-Vis Spectrophotometers
  • Transient Absorption
  • FTIR Spectrometers
  • Lasers and LEDs
  • Customisation Options
  • Software
  • Upgrades
  • All Products
  • Fluorescence Spectrometers
  • Raman Microscopes
  • UV-Vis Spectrophotometers
  • Transient Absorption
  • FTIR Spectrometers
  • Lasers and LEDs
  • Customisation Options
  • Software
  • Upgrades
  • All Products
LEGALS:
  • News
  • Events
  • Blog
  • Careers
  • Contact Us
  • Terms and Conditions
  • Privacy Policy
  • News
  • Events
  • Blog
  • Careers
  • Contact Us
  • Terms and Conditions
  • Privacy Policy
SOCIALS:
Youtube Linkedin X-twitter Facebook
©2024 Edinburgh Instruments. Registered in England and Wales No: 962331. VAT No: GB 271 7379 37
Manage Consent
To provide the best experiences, we use technologies like cookies to store and/or access device information. Consenting to these technologies will allow us to process data such as browsing behaviour or unique IDs on this site. Not consenting or withdrawing consent, may adversely affect certain features and functions.
Functional Always active
The technical storage or access is strictly necessary for the legitimate purpose of enabling the use of a specific service explicitly requested by the subscriber or user, or for the sole purpose of carrying out the transmission of a communication over an electronic communications network.
Preferences
The technical storage or access is necessary for the legitimate purpose of storing preferences that are not requested by the subscriber or user.
Statistics
The technical storage or access that is used exclusively for statistical purposes. The technical storage or access that is used exclusively for anonymous statistical purposes. Without a subpoena, voluntary compliance on the part of your Internet Service Provider, or additional records from a third party, information stored or retrieved for this purpose alone cannot usually be used to identify you.
Marketing
The technical storage or access is required to create user profiles to send advertising, or to track the user on a website or across several websites for similar marketing purposes.
Manage options Manage services Manage {vendor_count} vendors Read more about these purposes
View preferences
{title} {title} {title}