Mercury exists in three forms: elemental mercury (Hg0), inorganic mercury (Hg2+), and organic mercury (methyl mercury or other compounds). The highly toxic Hg2+ form can be generated during the extraction and handling of elemental mercury, which can subsequently contaminate soil and infiltrate aquifers. This poses a significant health risk, especially in major producing countries like Mexico. Despite its toxicity, mercury production remains high due to its use in applications such as gold extraction and chemical manufacturing.
Rapid, field-based monitoring of mercury contamination is essential, requiring methods that are portable, offer minimal analysis time, and need straightforward sample preparation.
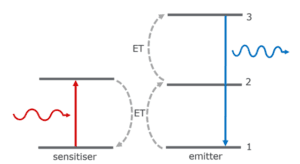
Researchers from the National Autonomous University of Mexico and the University of Guanajuato have addressed this need by developing a novel luminescent nanosensor for Hg2+ detection. This Research Highlight describes their novel strategy for spectral modulation of lanthanide-doped upconversion nanoparticles (UCNPs) via plasmonic interactions with gold nanoparticles (AuNPs).
This sensing approach utilises the interaction between the UCNP-AuNP system and Hg2+, which causes the quenching of the green emission. This quenching is enabled by Hg2+ altering the AuNP’s surface plasmon resonance. The resultant ratiometric luminescence response made the detection of Hg2+ sensitive and selective.
In this work, researchers characterised their sensors and monitored their colorimetric nanosensor assay using Edinburgh Instrument’s FS5 Spectrofluorometer and RMS1000 Confocal Multimodal Microscope (Figure 1). The dual emission-absorption capability of the FS5 was essential for accurate validation.
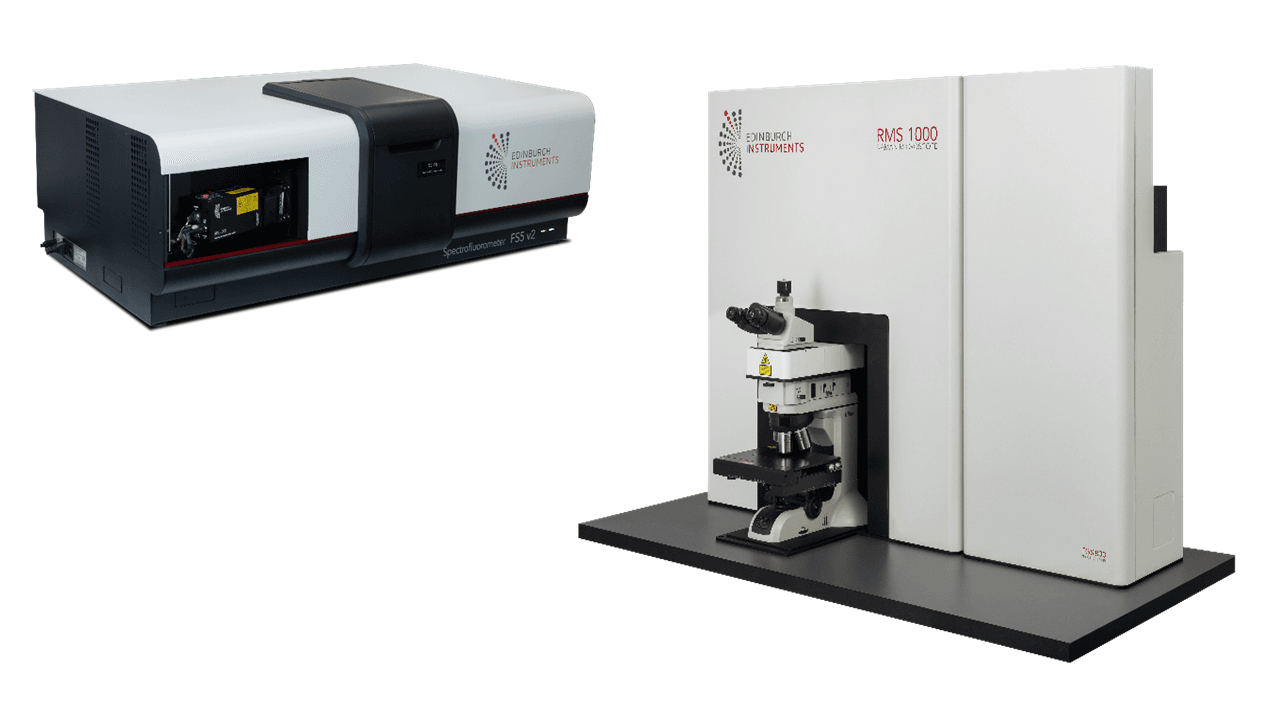
Figure 1. Edinburgh Instruments FS5 Spectrofluorometer (left) and RMS1000 Confocal Multimodal Microscope (right).
The UCNP-AuNP nanosensors for Hg2+ detection were synthesised and then characterised using an FS5 and RMS1000. These instruments were used to measure the samples’ absorption, photoluminescence emission, and Raman signatures.
Raman spectra were acquired using a 532 nm laser and a 20x objective. For the colorimetric Hg2+ detection assay, the 2-in-1 nature of the FS5 allowed efficient monitoring of the absorption and emission response in one instrument. Its excitation sources included a 150W Xenon arc lamp and a 310 mW continuous-wave 975 nm laser.
After synthesis, the researchers characterised their UCNP-AuNP nanosensor (Figure 2). The absorbance spectra showed a 520 nm maximum for both free and UCNP-AuNP heterostructure, indicating a stable structure even after interaction between UCNP and AuNP (Figure 2a).
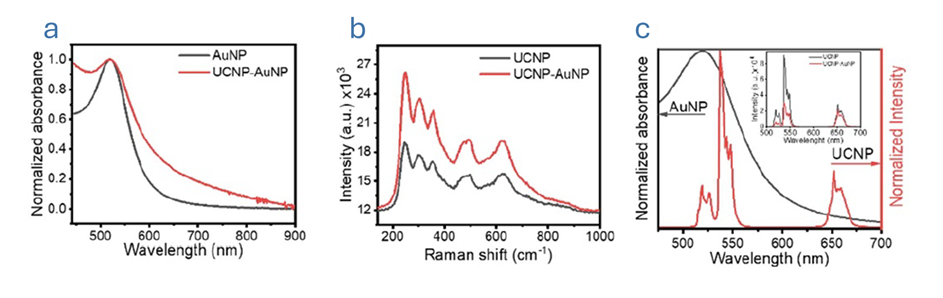
Figure 2. Characterisation of the UCNP-AuNP heterostructures. a) Absorption spectra, b) Raman spectra of the UCNP-AuNP system, c) Superposition of the absorption spectrum of AuNP and the emission spectrum of UCNP (inset: emission changes of UCNP upon association with AuNP in the heterostructures). The image is reprinted from J. M. González et al.1, Copyright (2025), with permission from the Journal of Physics: Photonics.
Raman spectroscopy was used to compare the UCNP and UCNP-AuNP. Both showed characteristic lattice vibrations of NaYF4. Furthermore, binding of AuNP to UCNP surface resulted in an increase in Raman signal due to localised surface plasmon resonance of the AuNP (Figure 2b).
When plotted, the plasmon resonance band of the AuNPs overlapped with the UCNP emission spectrum (under 975 nm excitation), particularly with the green emission peaks centred at 520 nm and 540 nm (Figure 2c). These peaks correspond to the Er3+ transitions 2H11/2 → 4I15/2 and 4S3/2 → 4I15/2, respectively. In contrast, the red emission at 655 nm (4F9/2 → 4I15/2 transition) showed minimal spectral overlap with the AuNP absorption band.
Consequently, upon conjugation of the nanoparticles, the UCNP emission intensity decreased, attributed to strong absorption by the AuNPs bound to the UCNP surface. This quenching effect was most pronounced in the green region, coinciding with the highest AuNP absorption. The plasmon-emission interaction was subsequently exploited as a modulation mechanism for emission intensity as a function of Hg²⁺ concentration since any change in the AuNP plasmon resonance was expected to produce a measurable variation in UCNP luminescence.
Having established the structural and spectral characteristics of the UCNP–AuNP heterostructure, the team next explored its analytical performance toward mercury detection. The nanosensors were mixed with different concentrations of Hg2+ then, absorption and emission spectroscopy measurements were performed (Figure 3).
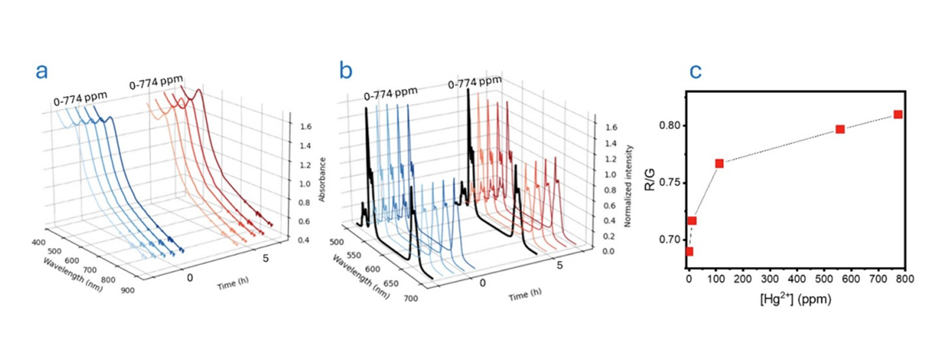
Figure 3. Optical response of the UCNP–AuNP nanosensor at increasing mercury concentrations. a) Absorption spectra after mixing and after 5 hours, b) Emission spectra normalised at 655 nm after mixing and after 5 hours, c) R/G ratio as a function of Hg2+ concentration. The image is reprinted from J. M. González et al.1, Copyright (2025), with permission from the Journal of Physics: Photonics.
To allow interaction, the samples were incubated for five hours. After this period, increasing Hg2+ concentrations led to two distinct changes (Figure 3a & b): i) an increase in absorption intensity and, ii) a red shift of the wavelength maximum absorption from 520 to 523 nm. The spectral shift was likely due to morphological modification of the AuNP resulting from deposition of elemental (Hg0) on the surface. The increase in absorbance intensity enhanced the spectral overlap with the 4S3/2 > 4I15/2 transitions, leading to a noticeable decrease in green band emission.
A luminescence calibration curve was created by plotting the red/green (R/G) ratio against the Hg2+ concentration. The curve demonstrated a progressive increase in the R/G ratio followed by saturation. This saturation occurred at relatively low concentrations of Hg2+, which limited the working range of the detection assay.
It was clear that the interaction between Hg2+ and UCNP-AuNP needed mediation to prevent saturation. The researchers therefore investigated the effect of incorporating diethylenetriamine (DETA) to enhance the interaction between AuNP and Hg2+ sensing process.
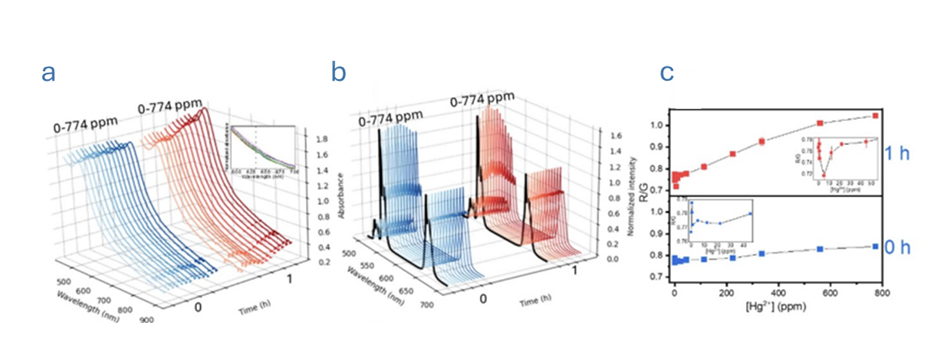
Figure 4. Response of UCNP-AuNP/DETA system in presence of Hg2+. a) Absorption spectra at 0 h and 1 h, b) emission spectra, c) R/G ratio at 0 and 1 h interaction. The image is reprinted from J. M. González et al.1, Copyright (2025), with permission from the Journal of Physics: Photonics.
One hour after mixing, a prominent enhancement in absorption intensity and reduction in green emission with increasing concentrations of Hg2+ was observed (Figure 4a & b). This led to large variations in the R/G ratio reaching an increase of approximately 25% compared to initial measurements (Figure 4c).
By linear fitting the R/G ratio in the region of low Hg2+ concentrations, the limit of detection was calculated to be 0.25 ppm. The addition of DETA not only improved analytical speed but also expanded the working range of the assay, demonstrating its suitability for near-real-time monitoring.
This work demonstrated the potential of the UCNP-AuNP/DETA system as a versatile platform for portable, user-friendly Hg2+ detection, and shows how dual-mode spectroscopy can accelerate field-deployable toxic metal sensing.
The FS5 and RMS1000 were both used for characterisation of these nanomaterials and for detecting emission changes related to sensing Hg2+. The 2-in-1 FS5 spectrometer allowed measurement of both absorption and fluorescence spectra in a single instrument. Overall, this work demonstrates how advanced spectroscopic tools, such as the FS5 and RMS1000, empower researchers to translate nanoscale phenomena into practical sensing technologies.
The results in this Research Highlight were published in Journal of Physics: Photonics. The full article can be found here: https://doi.org/10.1088/2515-7647/ae0121