Skip to content
Skip to content
  • News
  • Events
  • eBooks
  • Blog
  • Careers
  • Contact
  • News
  • Events
  • eBooks
  • Blog
  • Careers
  • Contact
KNOWLEDGEBASE
  • About Us
  • Products

    Fluorescence Spectrometers

    • FLS1000 Photoluminescence Spectrometer
    • FS5 Spectrofluorometer
    • LifeSpec II Lifetime Spectrometer
    • Mini-tau Lifetime Spectrometer

    Raman Microscopes

    • RM5 Raman Microscope
    • RMS1000 Multimodal Confocal Microscope

    Transient Absorption

    • LP980 Transient Absorption Spectrometer

    FTIR Spectrometers

    • IR5 FTIR Spectrometer

    Lasers and LEDs

    • Pulsed Lasers
    • Gas Lasers
    • Customisation Options
    View All Products
  • Techniques
  • Applications
KNOWLEDGEBASE
Edit Content
  • About Us
  • Products
  • Techniques
  • Applications
  • Knowledgebase
  • eBooks
  • News
  • Events
  • Blog
  • Careers
  • Contact Us

RESOURCES

NIR Emission Spectra of PbS Quantum Dots Using the FS5 Spectrofluorometer

  • December 11, 2023

KEY POINTS

  • The FS5 Spectrofluorometer with an NIR InGaAs detector can measure emission spectra up to 1650 nm.
  • Absorption and emission spectra of PbS quantum dots are measured using the FS5.
  • Solvent absorption in the NIR can distort emission spectra, making appropriate solvent choice highly important.
Edit Content

Near infrared emitting (NIR) semiconductor quantum dots (QDs) possess highly tuneable properties, and high photoluminescence quantum yields. In biological imaging, it is highly advantageous to synthesise probes with absorption and emission wavelengths in the NIR region. Firstly, this will prevent damage to biological tissues, which is a fundamental drawback of UV region fluorophores. Secondly, these wavelengths have increased tissue penetration, which is ideal for surgical applications, and finally show increased spatial resolution.1,2

One commercially available series of NIR-emitting QDs are lead sulfide (PbS) QDs. Their tuneable emission characteristics are controlled by capping with amphiphilic molecules, which aid the stabilisation of small-sized nanoparticles, preventing uncontrolled growth.3 To characterise these useful materials, QDs are often studied in solution, where they must be dispersed. QDs are often designed to be hydrophobic, requiring the use of an organic solvent for dispersion. However, the NIR absorption of organic solvents can interfere with the emission of the sample. In this application note, the photoluminescence spectra of NIR PbS quantum dots are measured in three organic solvents using the FS5 Spectrometer equipped with an NIR InGaAs detector.

Materials & Methods

PbS QDs were acquired from Quantum Solutions. Dispersions were prepared in tetrachloroethylene (PCE) (anhydrous, Sigma), dichloromethane (DCM) (Uvasol®, Merck), and toluene (anhydrous, Sigma) with an absorbance of ~0.1 at the excitation wavelength of 670 nm. Samples were loaded into 10 mm pathlength 4-sided cuvettes. The DS5 UV-Vis Spectrophotometer was used for absorbance measurements. For emission spectra, measurements were made using the FS5 Spectrofluorometer (Figure 1) equipped with a
150 W Xe arc lamp and a InGaAs-1650 NIR detector (NIRA+ upgrade). Cuvettes were held in the SC-05 Standard Cuvette Holder Module.

FS5 Spectrofluorometer

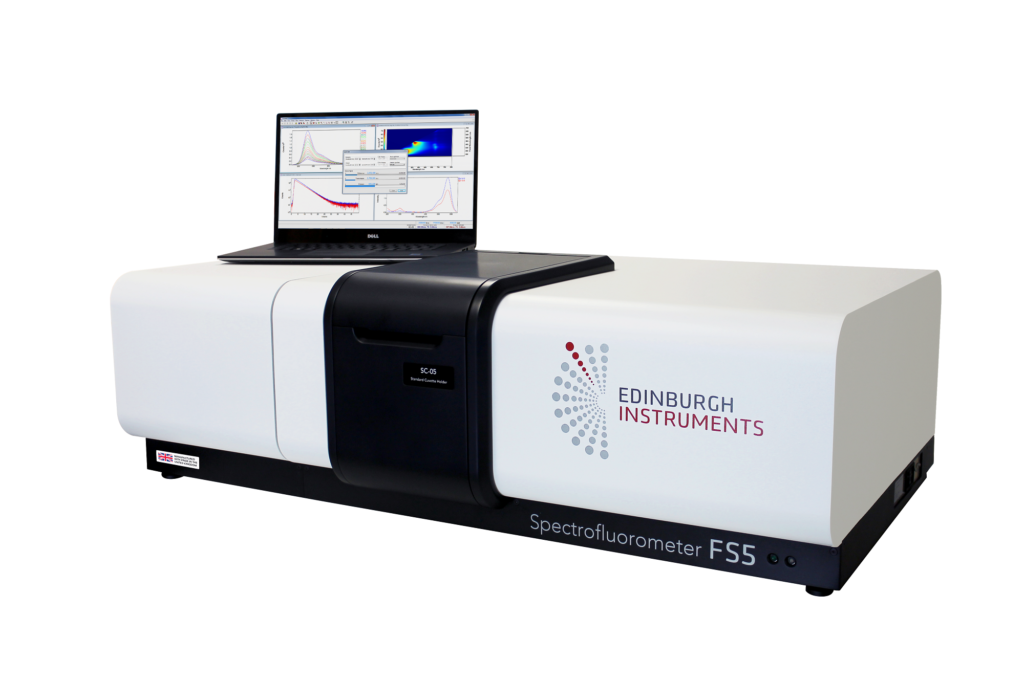
Figure 1. Edinburgh Instruments FS5 Spectrofluorometer.

Absorption & Emission Spectra of PbS

The absorption and emission of PbS QDs were measured using the DS5 and FS5. The DS5 has an extended range absorption range to 1100 nm, allowing the NIR absorption peak of PbS in PCE to be recorded (Figure 2).


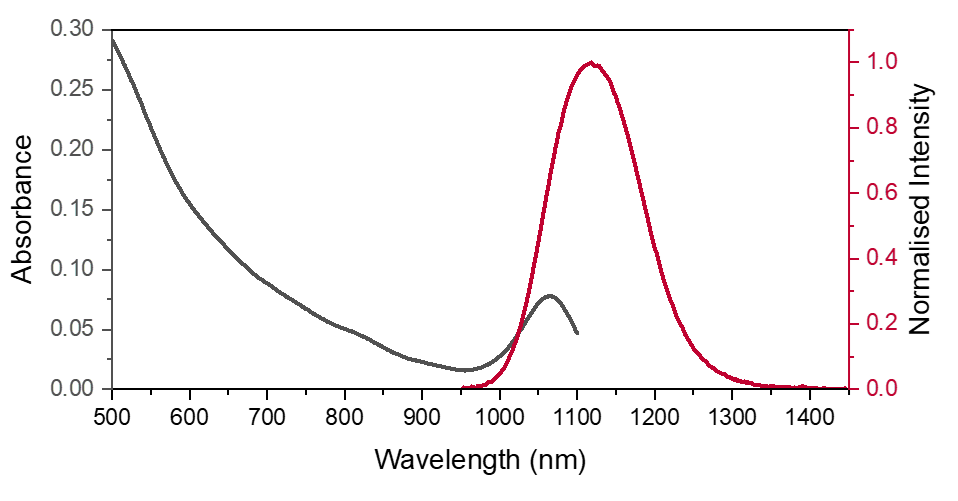
Figure 2. Absorption spectrum of PbS QDs in PCE measured on the DS5 from 500-1100 nm (black). Normalised emission spectrum of PbS QDs in PCE (red), excited at 670 nm.

The absorption of PbS in PCE shows two important features, a broad visible absorption band up to 950 nm and narrow NIR absorption band centred at 1050 nm. This longer wavelength absorption band overlaps with the emission band of PbS QDs in PCE. The small Stokes shift between the absorption and emission NIR peaks results in a high degree of spectral overlap shown in Figure 2. This could cause reabsorption which reduces the emission on the rising edge of the spectra and resulting in spectral distortion. It is therefore important to keep the concentration low enough to minimise this effect, which is a common feature in NIR emitters.

Influence of the Solvent on the PbS Emission Spectrum

QDs may be dissolved in a range of organic solvents. To investigate the influence of the solvent on the emission spectra, the same QDs were suspended in DCM and toluene. The resulting normalised spectra are shown in Figure 3 and highlight the importance of solvent choice when measuring emission spectra in the NIR.

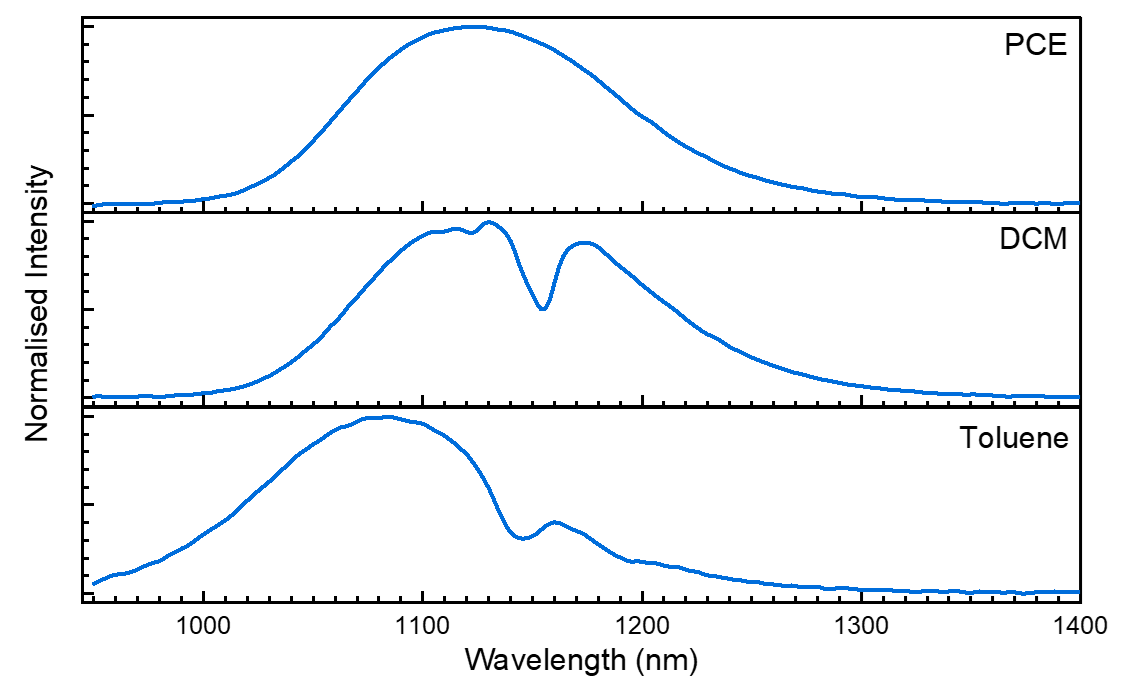
Figure 3. Emission spectra of PbS QDs in PCE (top), DCM (middle), and toluene (bottom) excited at 670 nm.

The emission peak is shifted by solvent interactions, with toluene shifted to shorter wavelengths than PCE and DCM. However, the more extreme effect is that of the troughs within the emission peak caused by direct absorption of the PbS emission by the toluene and DCM solvent molecules.

Many common solvents have absorption bands that can interfere with the sample emission profile in the NIR. This makes checking the properties of the solvent especially important when collecting emissions in the NIR region.4

Conclusion

The FS5 Spectrofluorometer can measure emission spectra up to 1650 nm when equipped with the InGaAs-1650 NIR detector (NIRA+ upgrade). It has been shown that common solvents such as toluene and DCM have absorption bands above 1000 nm, which can obstruct the emission spectrum of the NIR-emitting sample. These solvent effects make further measurements such as quantum yield challenging in as the solvent absorption must be considered for an accurate quantum yield value.

 References

  1. Imamura, S. Yamada, S. Tsuboi, Y. Nakane, Y. Tsukasaki, A. Komatsuzaki and T. Jin, Near-infrared emitting PbS quantum dots for in vivo fluorescence imaging of the thrombotic state in septic mouse brain, Molecules, 2016, 21, 1-12.
  2. Asha Krishnan, K. Yadav, P. Roach and V. Chelvam, A targeted near-infrared nanoprobe for deep-tissue penetration and imaging of prostate cancer, Biomater Sci, 2021, 9, 2295–2312.
  3. Gulati, M. Sachdeva and K. K. Bhasin, in AIP Conference Proceedings, AIP, 2018, p. 030214.
  4. Hoshi, K. Suzuki, N. Hasebe, T. Yoshihara and S. Tobita, Absolute Quantum Yield Measurements of Near-Infrared Emission with Correction for Solvent Absorption, Anal Chem, 2020, 92, 607–611.

RELATED PRODUCTS

FLS1000

Photoluminescence Spectrometer

VIEW

FS5

Spectrofluorometer

VIEW

Contact our expert team today to find out more about how our products can improve your research

Contact Us
PrevPrevious
NextNext
Previous Raman Imaging of Strain in a Silicon Semiconductor Wafer Next Raman Microscopy for the Characterisation of Antihistamine Formulations

RESOURCES

Tags:
  • Application Notes
  • Quantum Dots
  • FLS1000
  • FS5
  • Photoluminescence
Share:

Keep up to date with the latest from Edinburgh Instruments

Join our mailing list and keep up with our latest videos, app notes and more!

LOCATION:
  • Edinburgh Instruments Ltd.
    2 Bain Square, Kirkton Campus, Livingston, EH54 7DQ.
  • sales@edinst.com
  • +44 1506 425 300
ABOUT:
  • About Us
  • Techniques
  • Applications
  • Knowledgebase
  • About Us
  • Techniques
  • Applications
  • Knowledgebase
PRODUCTS:
  • Fluorescence Spectrometers
  • Raman Microscopes
  • UV-Vis Spectrophotometers
  • Transient Absorption
  • FTIR Spectrometers
  • Lasers and LEDs
  • Customisation Options
  • Software
  • Upgrades
  • All Products
  • Fluorescence Spectrometers
  • Raman Microscopes
  • UV-Vis Spectrophotometers
  • Transient Absorption
  • FTIR Spectrometers
  • Lasers and LEDs
  • Customisation Options
  • Software
  • Upgrades
  • All Products
LEGALS:
  • News
  • Events
  • Blog
  • Careers
  • Contact Us
  • Terms and Conditions
  • Privacy Policy
  • News
  • Events
  • Blog
  • Careers
  • Contact Us
  • Terms and Conditions
  • Privacy Policy
SOCIALS:
Youtube Linkedin X-twitter Facebook
©2024 Edinburgh Instruments. Registered in England and Wales No: 962331. VAT No: GB 271 7379 37
Manage Consent
To provide the best experiences, we use technologies like cookies to store and/or access device information. Consenting to these technologies will allow us to process data such as browsing behaviour or unique IDs on this site. Not consenting or withdrawing consent, may adversely affect certain features and functions.
Functional Always active
The technical storage or access is strictly necessary for the legitimate purpose of enabling the use of a specific service explicitly requested by the subscriber or user, or for the sole purpose of carrying out the transmission of a communication over an electronic communications network.
Preferences
The technical storage or access is necessary for the legitimate purpose of storing preferences that are not requested by the subscriber or user.
Statistics
The technical storage or access that is used exclusively for statistical purposes. The technical storage or access that is used exclusively for anonymous statistical purposes. Without a subpoena, voluntary compliance on the part of your Internet Service Provider, or additional records from a third party, information stored or retrieved for this purpose alone cannot usually be used to identify you.
Marketing
The technical storage or access is required to create user profiles to send advertising, or to track the user on a website or across several websites for similar marketing purposes.
Manage options Manage services Manage {vendor_count} vendors Read more about these purposes
View preferences
{title} {title} {title}