A fluorescence spectrometer, also known as a fluorometer, spectrofluorometer or photoluminescence spectrometer, is an analytical instrument used to study the fluorescence properties of a sample. It excites a sample with a specific wavelength of light and measures the intensity and spectral distribution of the resulting fluorescence emission. Fluorescence spectrometers are used in various fields, such as biochemistry, photochemistry, medical diagnostics, environmental analysis, and materials science.
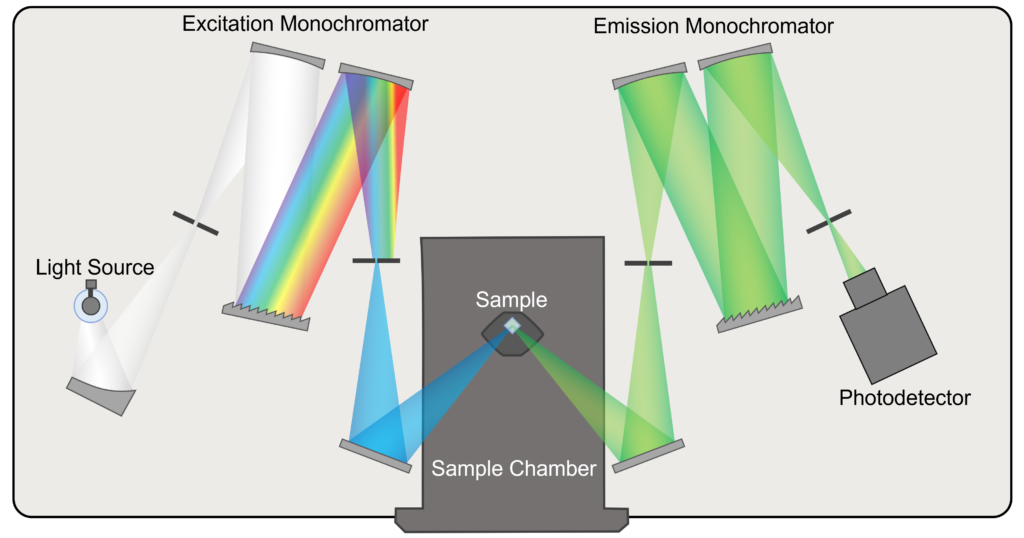
The optical layout and key components of a fluorescence spectrometer are shown in Figure 1. The sample being analysed is placed in the sample chamber and excited with a chosen wavelength of light that is selected by the excitation monochromator. Fluorescence from the sample is wavelength selected using the emission monochromator and detected by the photodetector. This design of fluorescence spectrometer, with monochromators for excitation and emission wavelength selection, is the most flexible for a wide range of applications and the focus of this Spectral School. Simpler filter-based instruments that select the excitation and emission wavelengths using filters also exist but are usually tailored for a specific application or assay.

Figure 1: Optical Layout of a Fluorescence Spectrometer.
Light sources for fluorescence spectrometers can be grouped into two types: broadband and monochromatic. The most widely used broadband source is the Xenon Arc Lamp. Arc lamps are ideal light sources for fluorescence spectroscopy as they emit high-intensity light in a continuous spectrum across the UV-Vis-NIR region of the electromagnetic spectrum. This provides excellent flexibility as samples can be excited using a wide range of wavelengths.
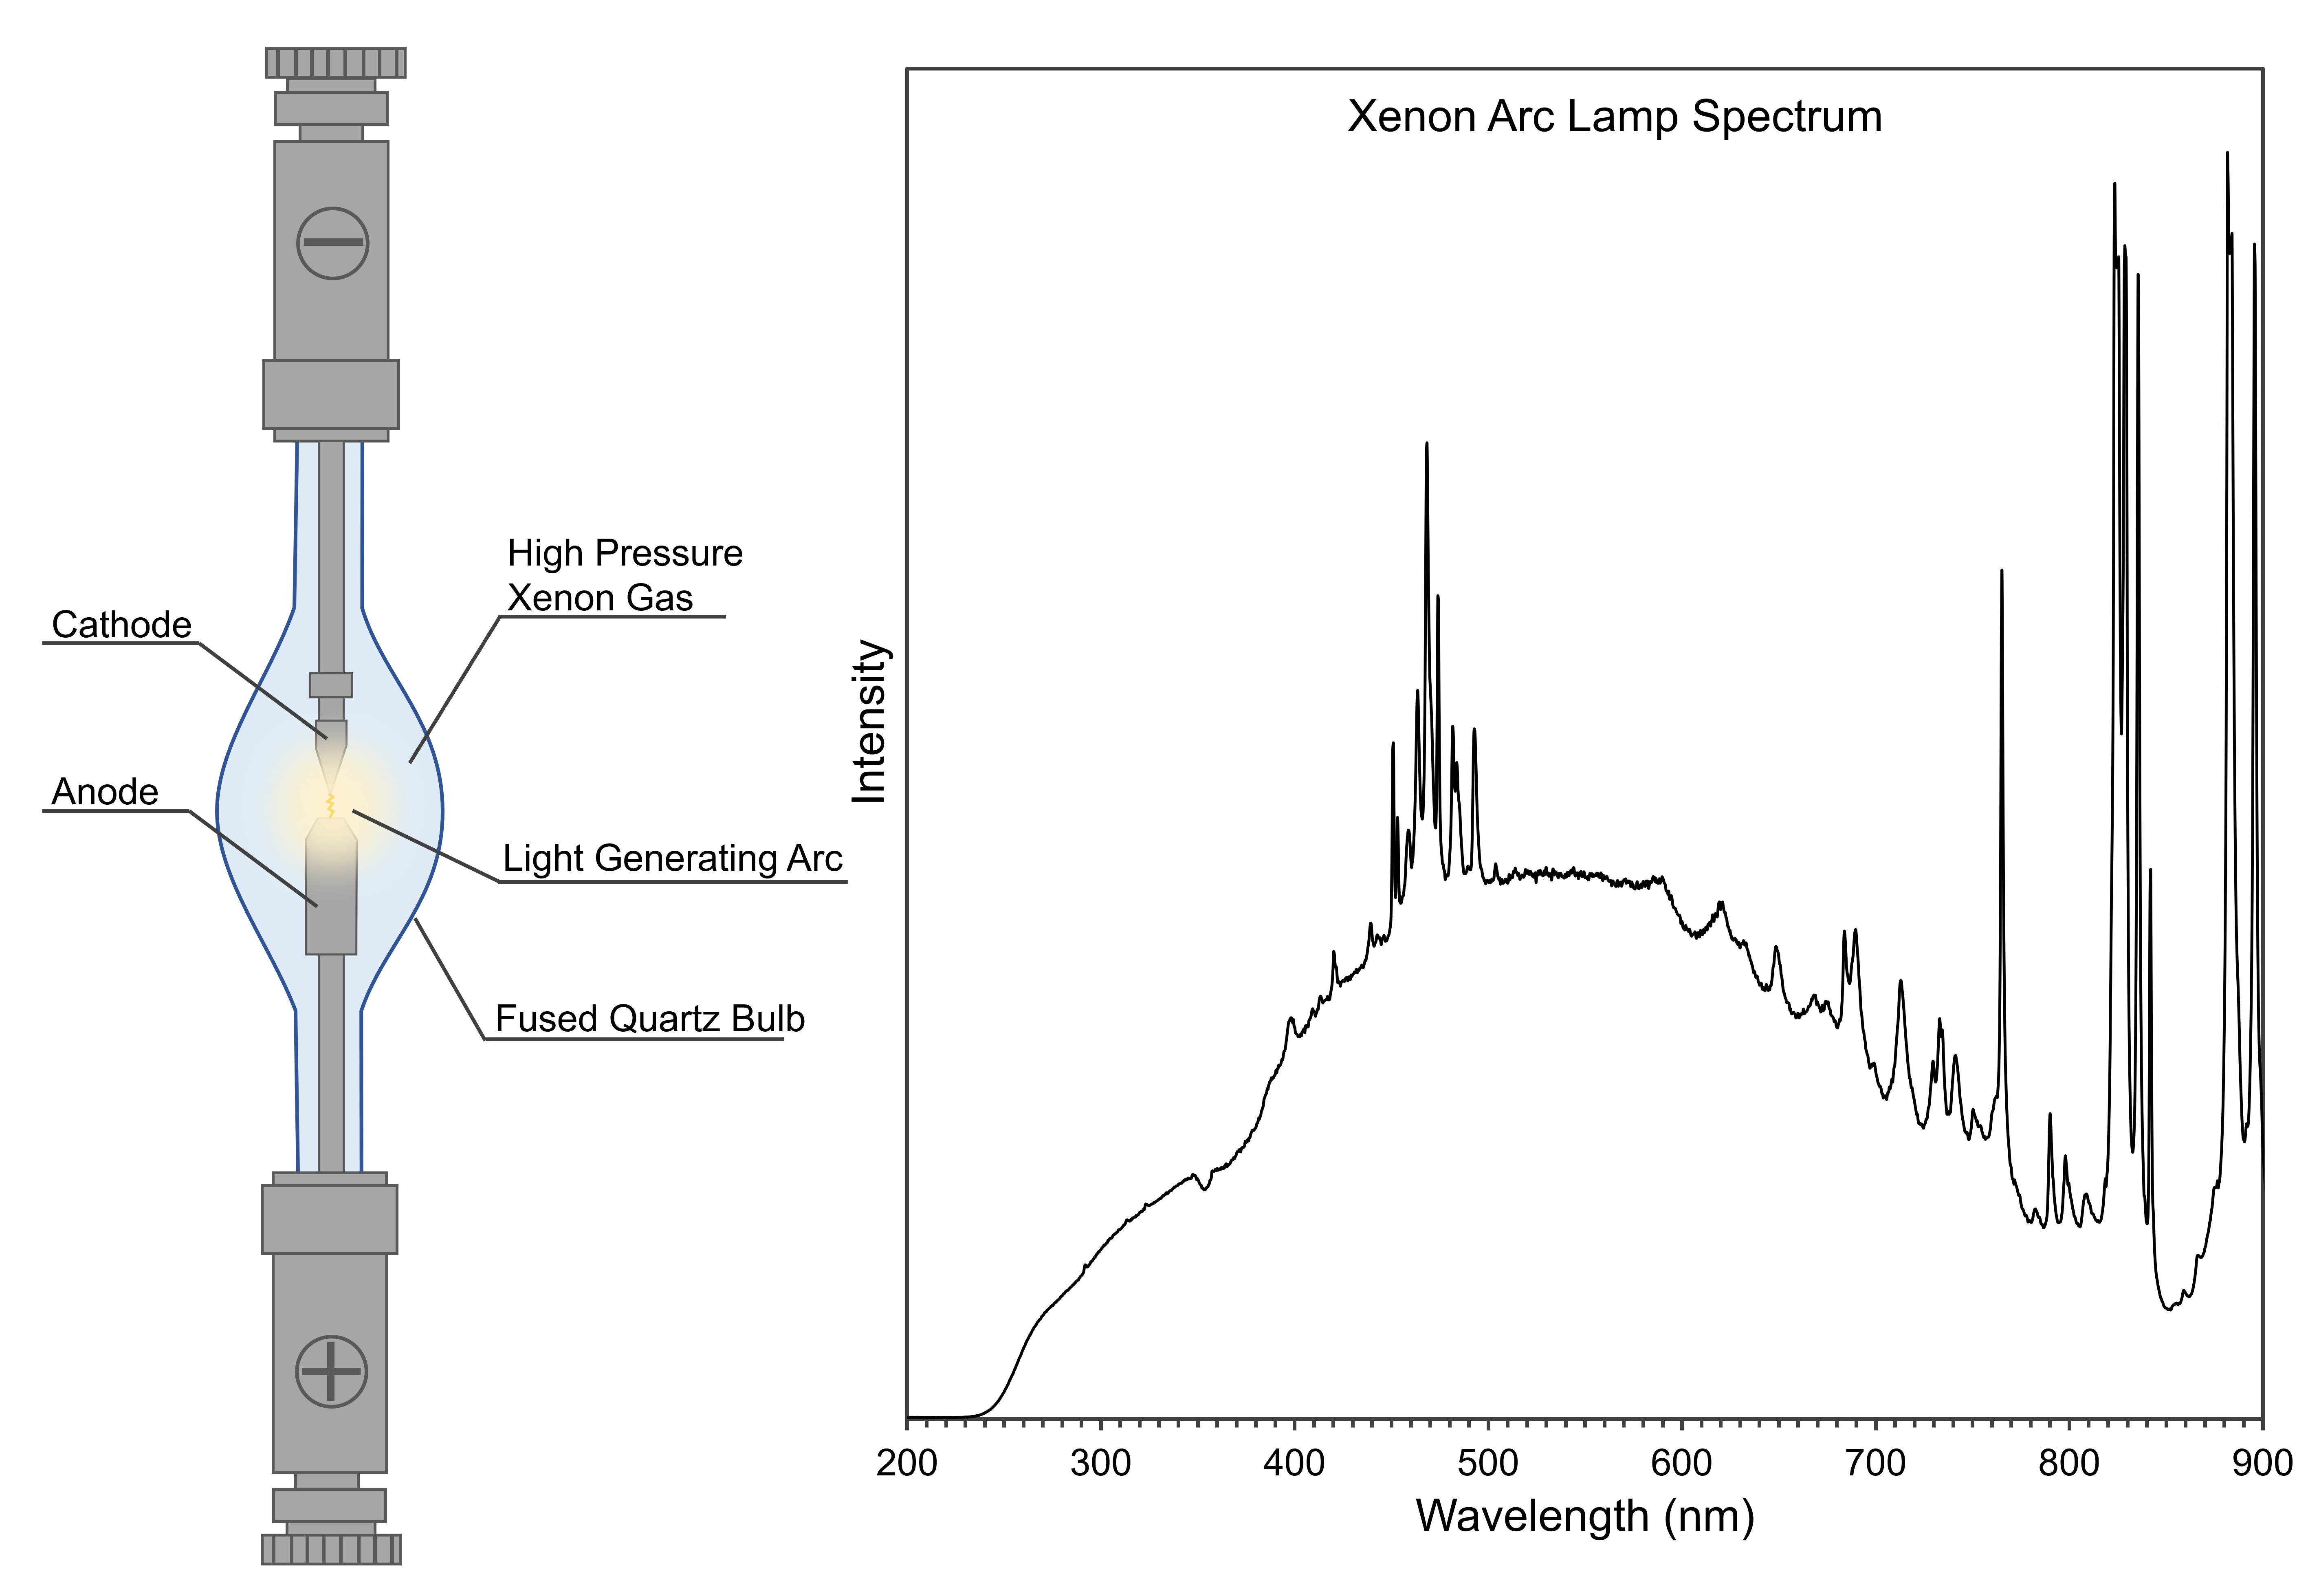
Figure 2. Xenon Arc Lamp Schematic and Ozone Free Arc Lamp Emission Spectrum.
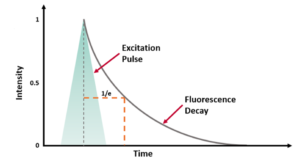
An alternative to the broadband sources is to use a monochromatic laser. The advantage of lasers is that they can deliver higher light intensities than arc lamps and therefore can be used to analyse very weakly emitting samples with low quantum yields. The downside is the wavelength is fixed and multiple lasers are therefore required if different excitation wavelengths are needed. Lasers do not require an excitation monochromator and are coupled to the sample chamber directly. Pulsed laser sources are also often used for fluorescence lifetime spectroscopy.
The excitation monochromator selects the desired excitation wavelength from the white light output of the xenon arc lamp. The white light from the lamp is imaged onto a diffraction grating which has a surface of thousands of finely spaced grooves. Diffraction from this grooved surface spatially separates the light into its constituent wavelengths. The diffracted light is imaged onto a slit consisting of two metal blades with a gap between them. The slit transmits the desired excitation wavelength and blocks the other wavelengths.
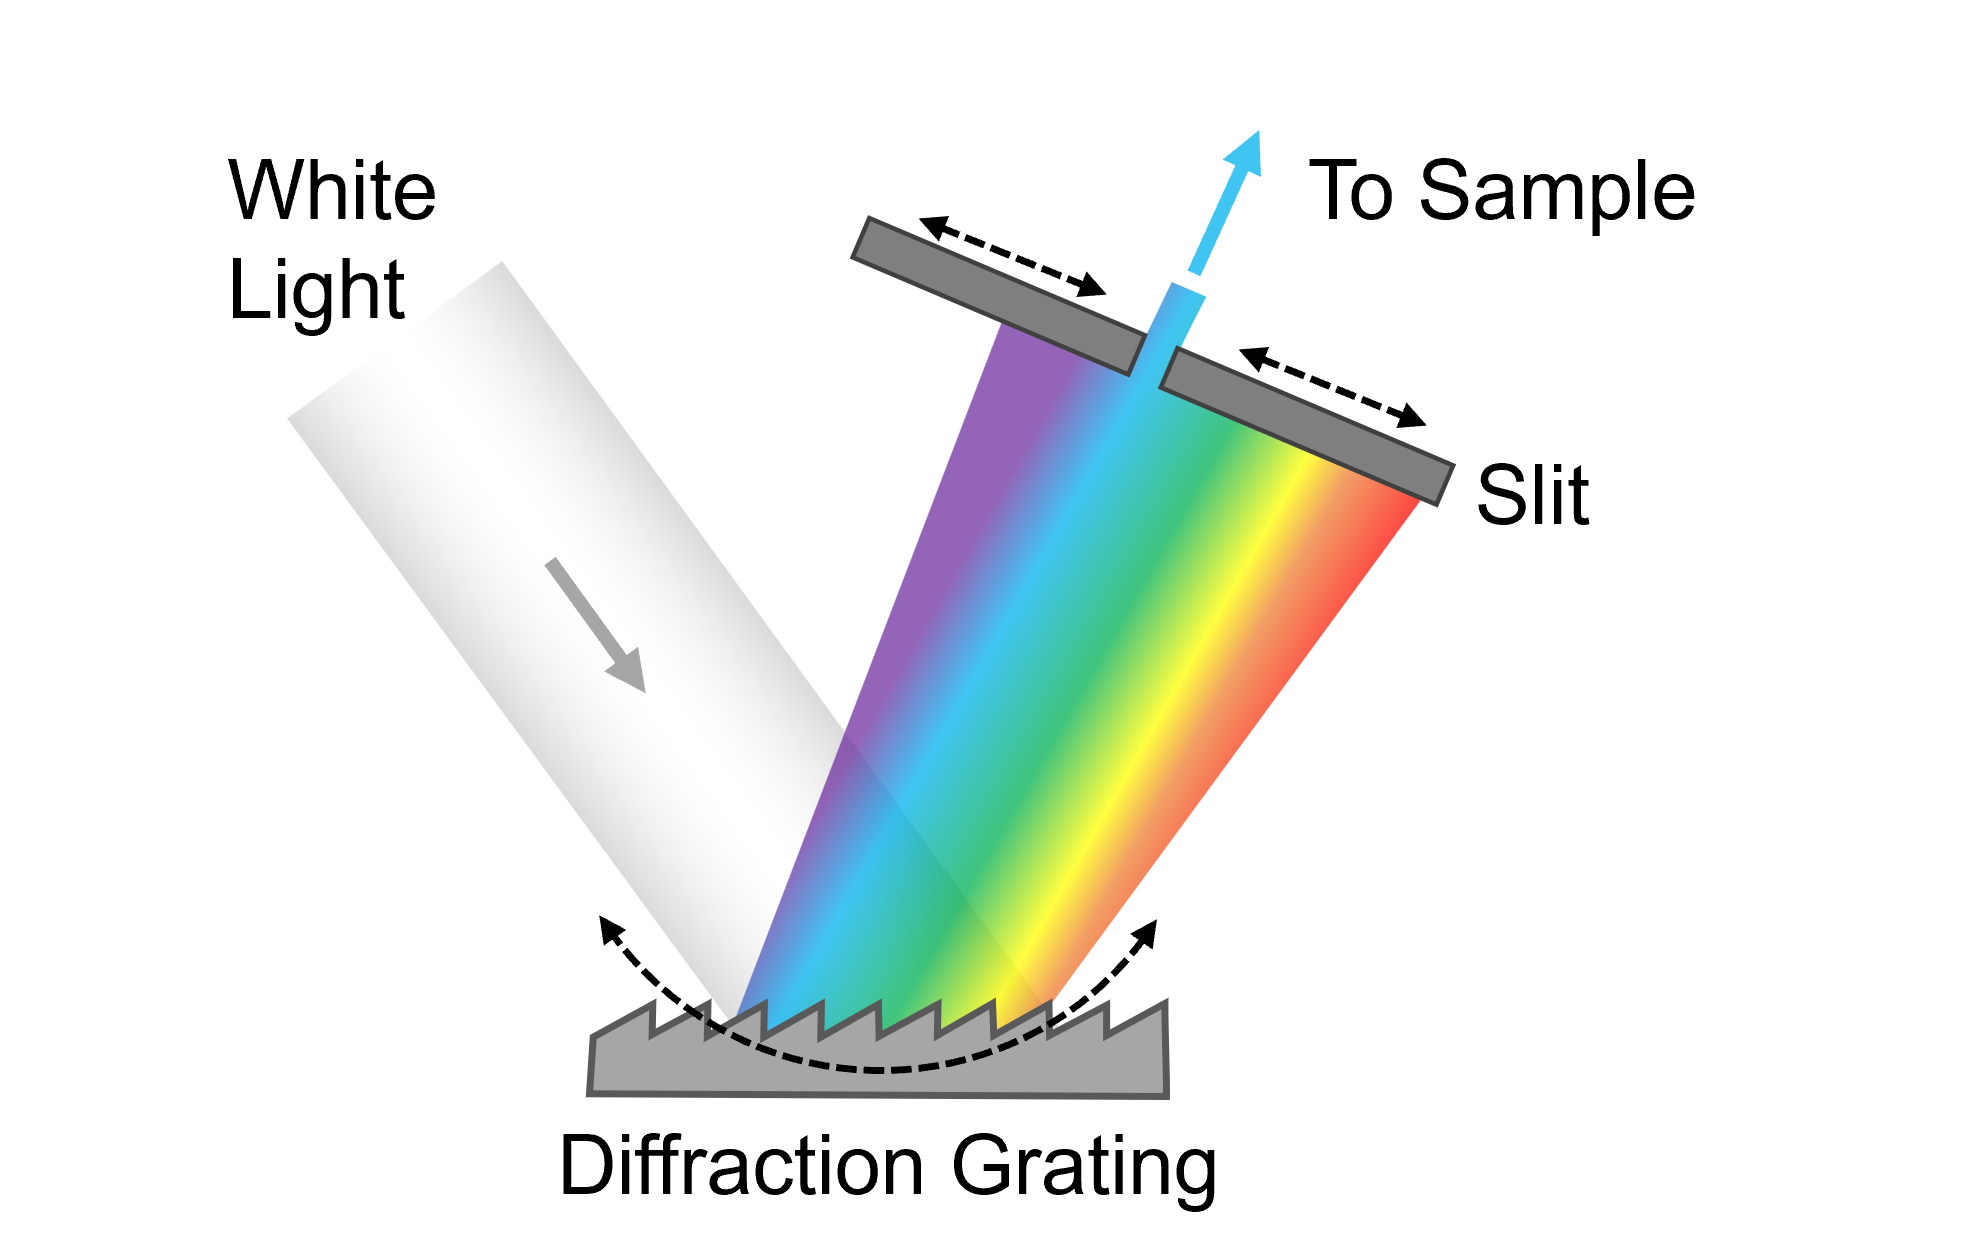
Figure 3. Excitation Monochromator.
The centre wavelength of the light transmitted by the slit is determined by the angle of the diffraction grating relative to the incoming white light, and the wavelength is chosen by rotating the angle of the grating. The bandwidth (range of wavelengths) transmitted can be adjusted by moving the blades to widen or narrow the gap; the narrower the slit, the more monochromatic the light.
The optical layout in Figure 3 is a simplification and there are often additional optics in the monochromator. A widely used monochromator optical design for fluorescence spectroscopy is the Czerny-Turner arrangement which comprises one diffraction grating and two concave mirrors and is the arrangement shown in Figure 1.
The sample being measured is placed in the sample chamber of the spectrometer. The most common sample type is a dye solution in a cuvette. The excitation light is partially absorbed by the solution and the emitted fluorescence is collected at 90° to the excitation light. The advantage of 90° collection is that the transmitted excitation light does not enter the emission monochromator, which reduces the background signal and greatly improves the sensitivity of the measurement.
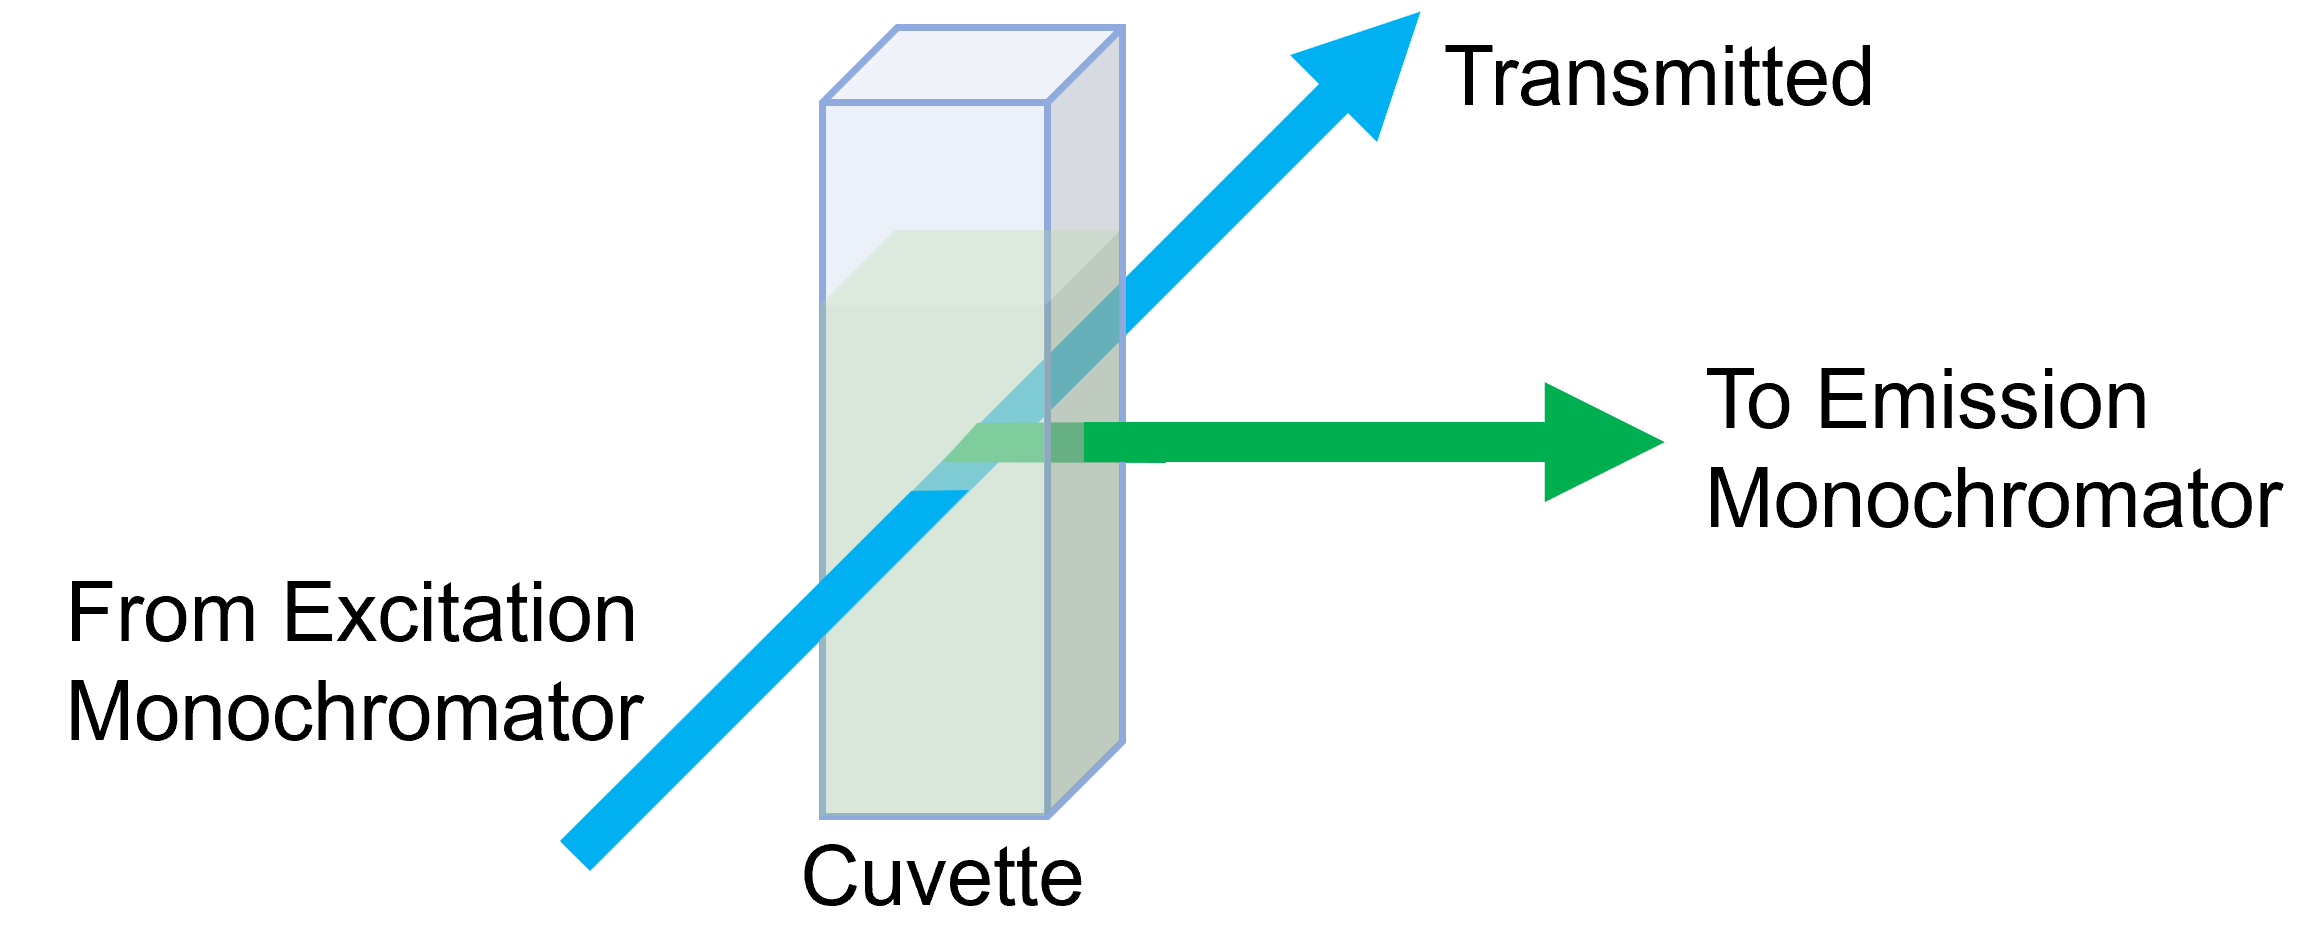
Figure 4. 90° Measurement Geometry.
Fluorescence spectrometers often have a range of other sample holders available that are designed for different sample types and experiential conditions. The FS5 Spectofluorometer has over 15 sample modules available, including film holders, powder holders, cryostats for temperature-dependent fluorescence, and integrating spheres for quantum yield.
After the sample chamber is the emission monochromator which selects the fluorescence emission wavelength that reaches the photodetector and operates identically to the excitation monochromator. Widening the slit in the emission monochromator increases the intensity of the fluorescence and improves the sensitivity but decreases the resolution of acquired fluorescence emission spectra.
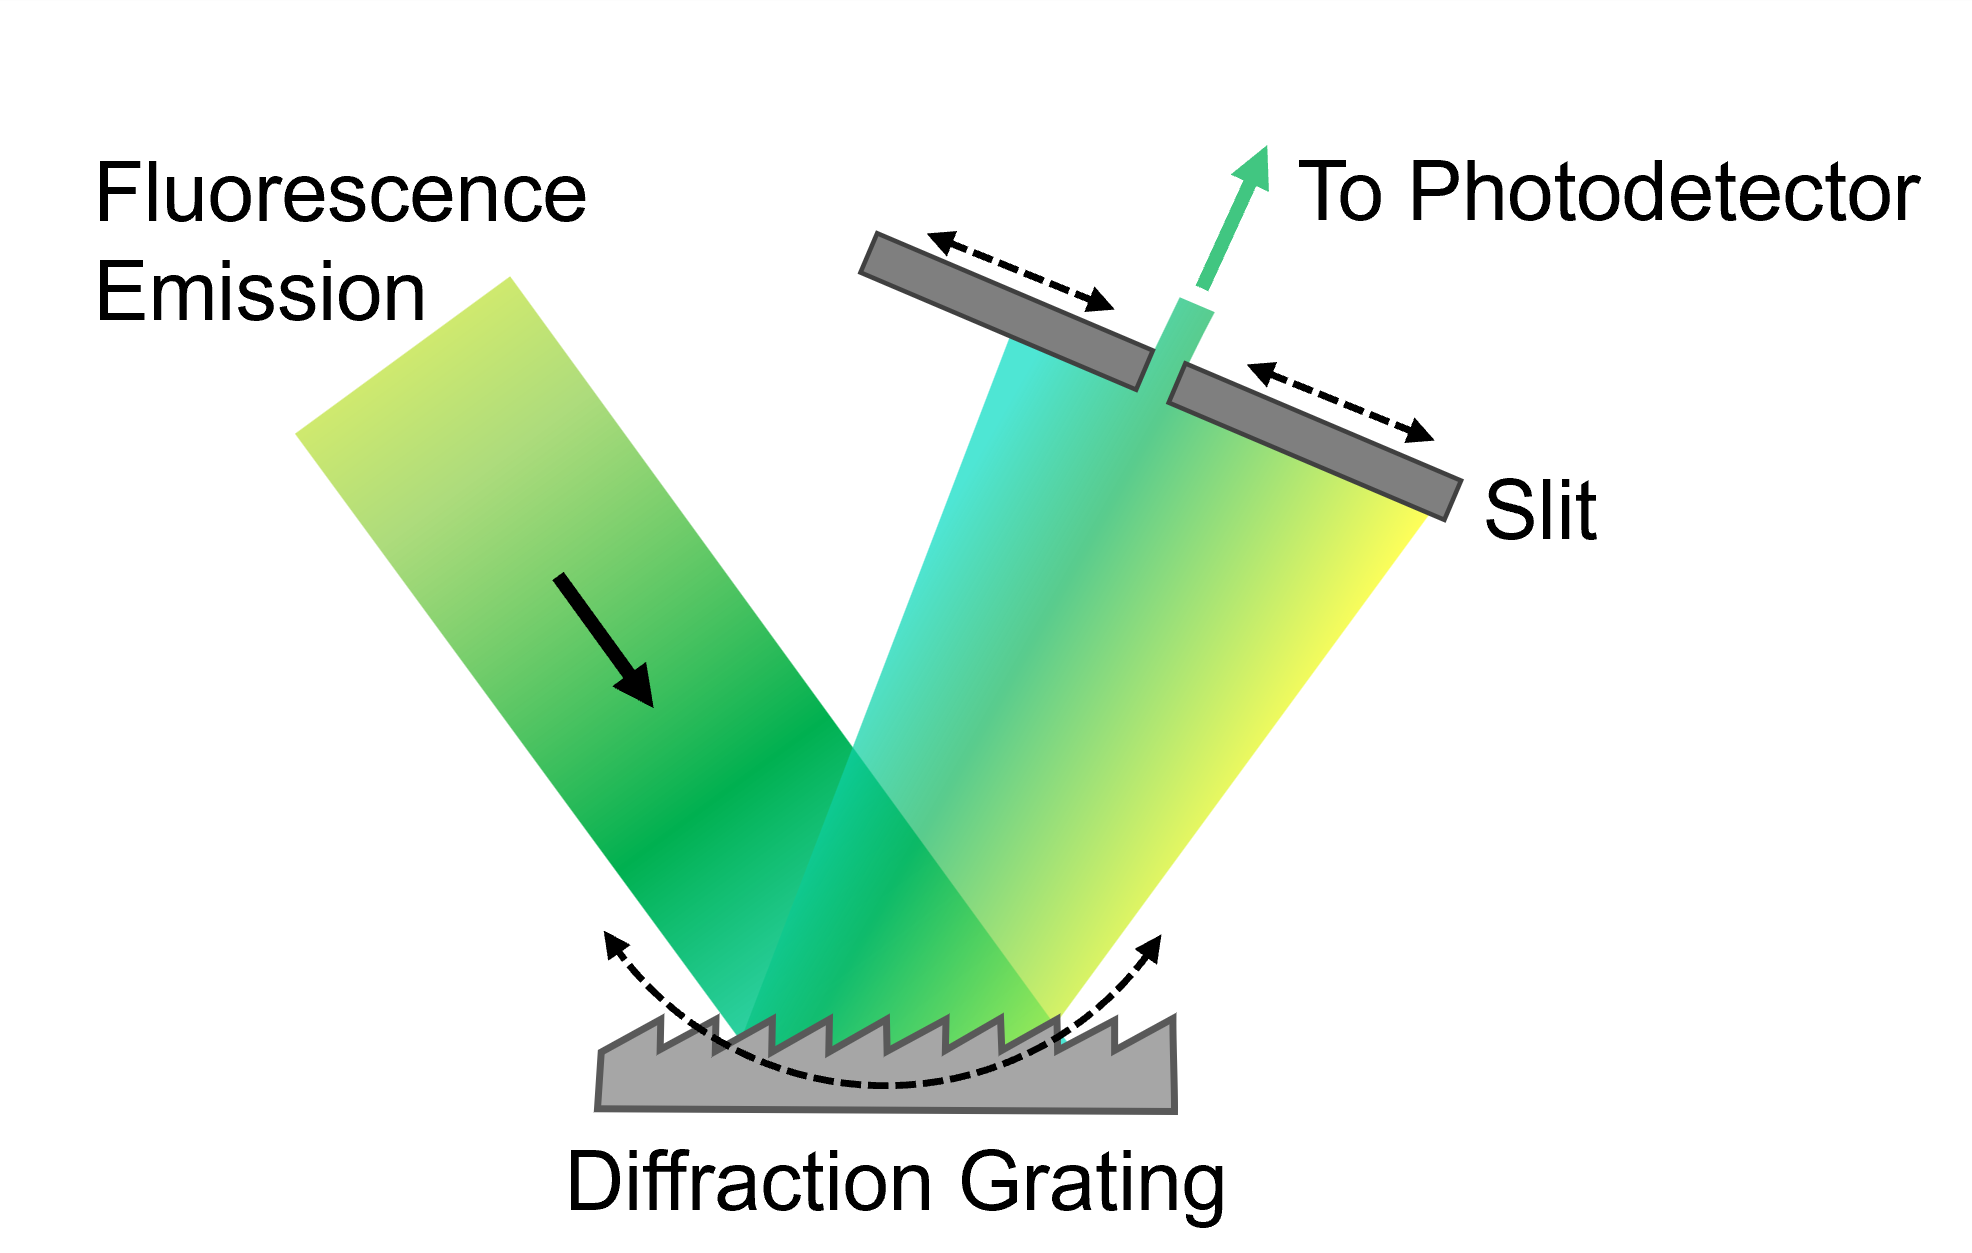
Figure 5. Emission Monochromator.
The final component is the photodetector which converts the fluorescence photons into an electrical signal. The most popular photodetector for fluorescence spectroscopy is the photomultiplier tube (PMT) due to its excellent light sensitivity. The PMT is a vacuum tube containing a photocathode, a series of electron multipliers called dynodes, and an anode. A high voltage is applied across these components to drive electrons from the photocathode towards the anode.
When a photon strikes the photocathode, a photoelectron is emitted into the vacuum and accelerated by the applied voltage onto the first dynode where it is multiplied by secondary electron emission. This process of electron multiplication is repeated at each successive dynode in the chain and is why PMTs are so sensitive. The multiplied secondary electrons are then collected by the anode and recorded.
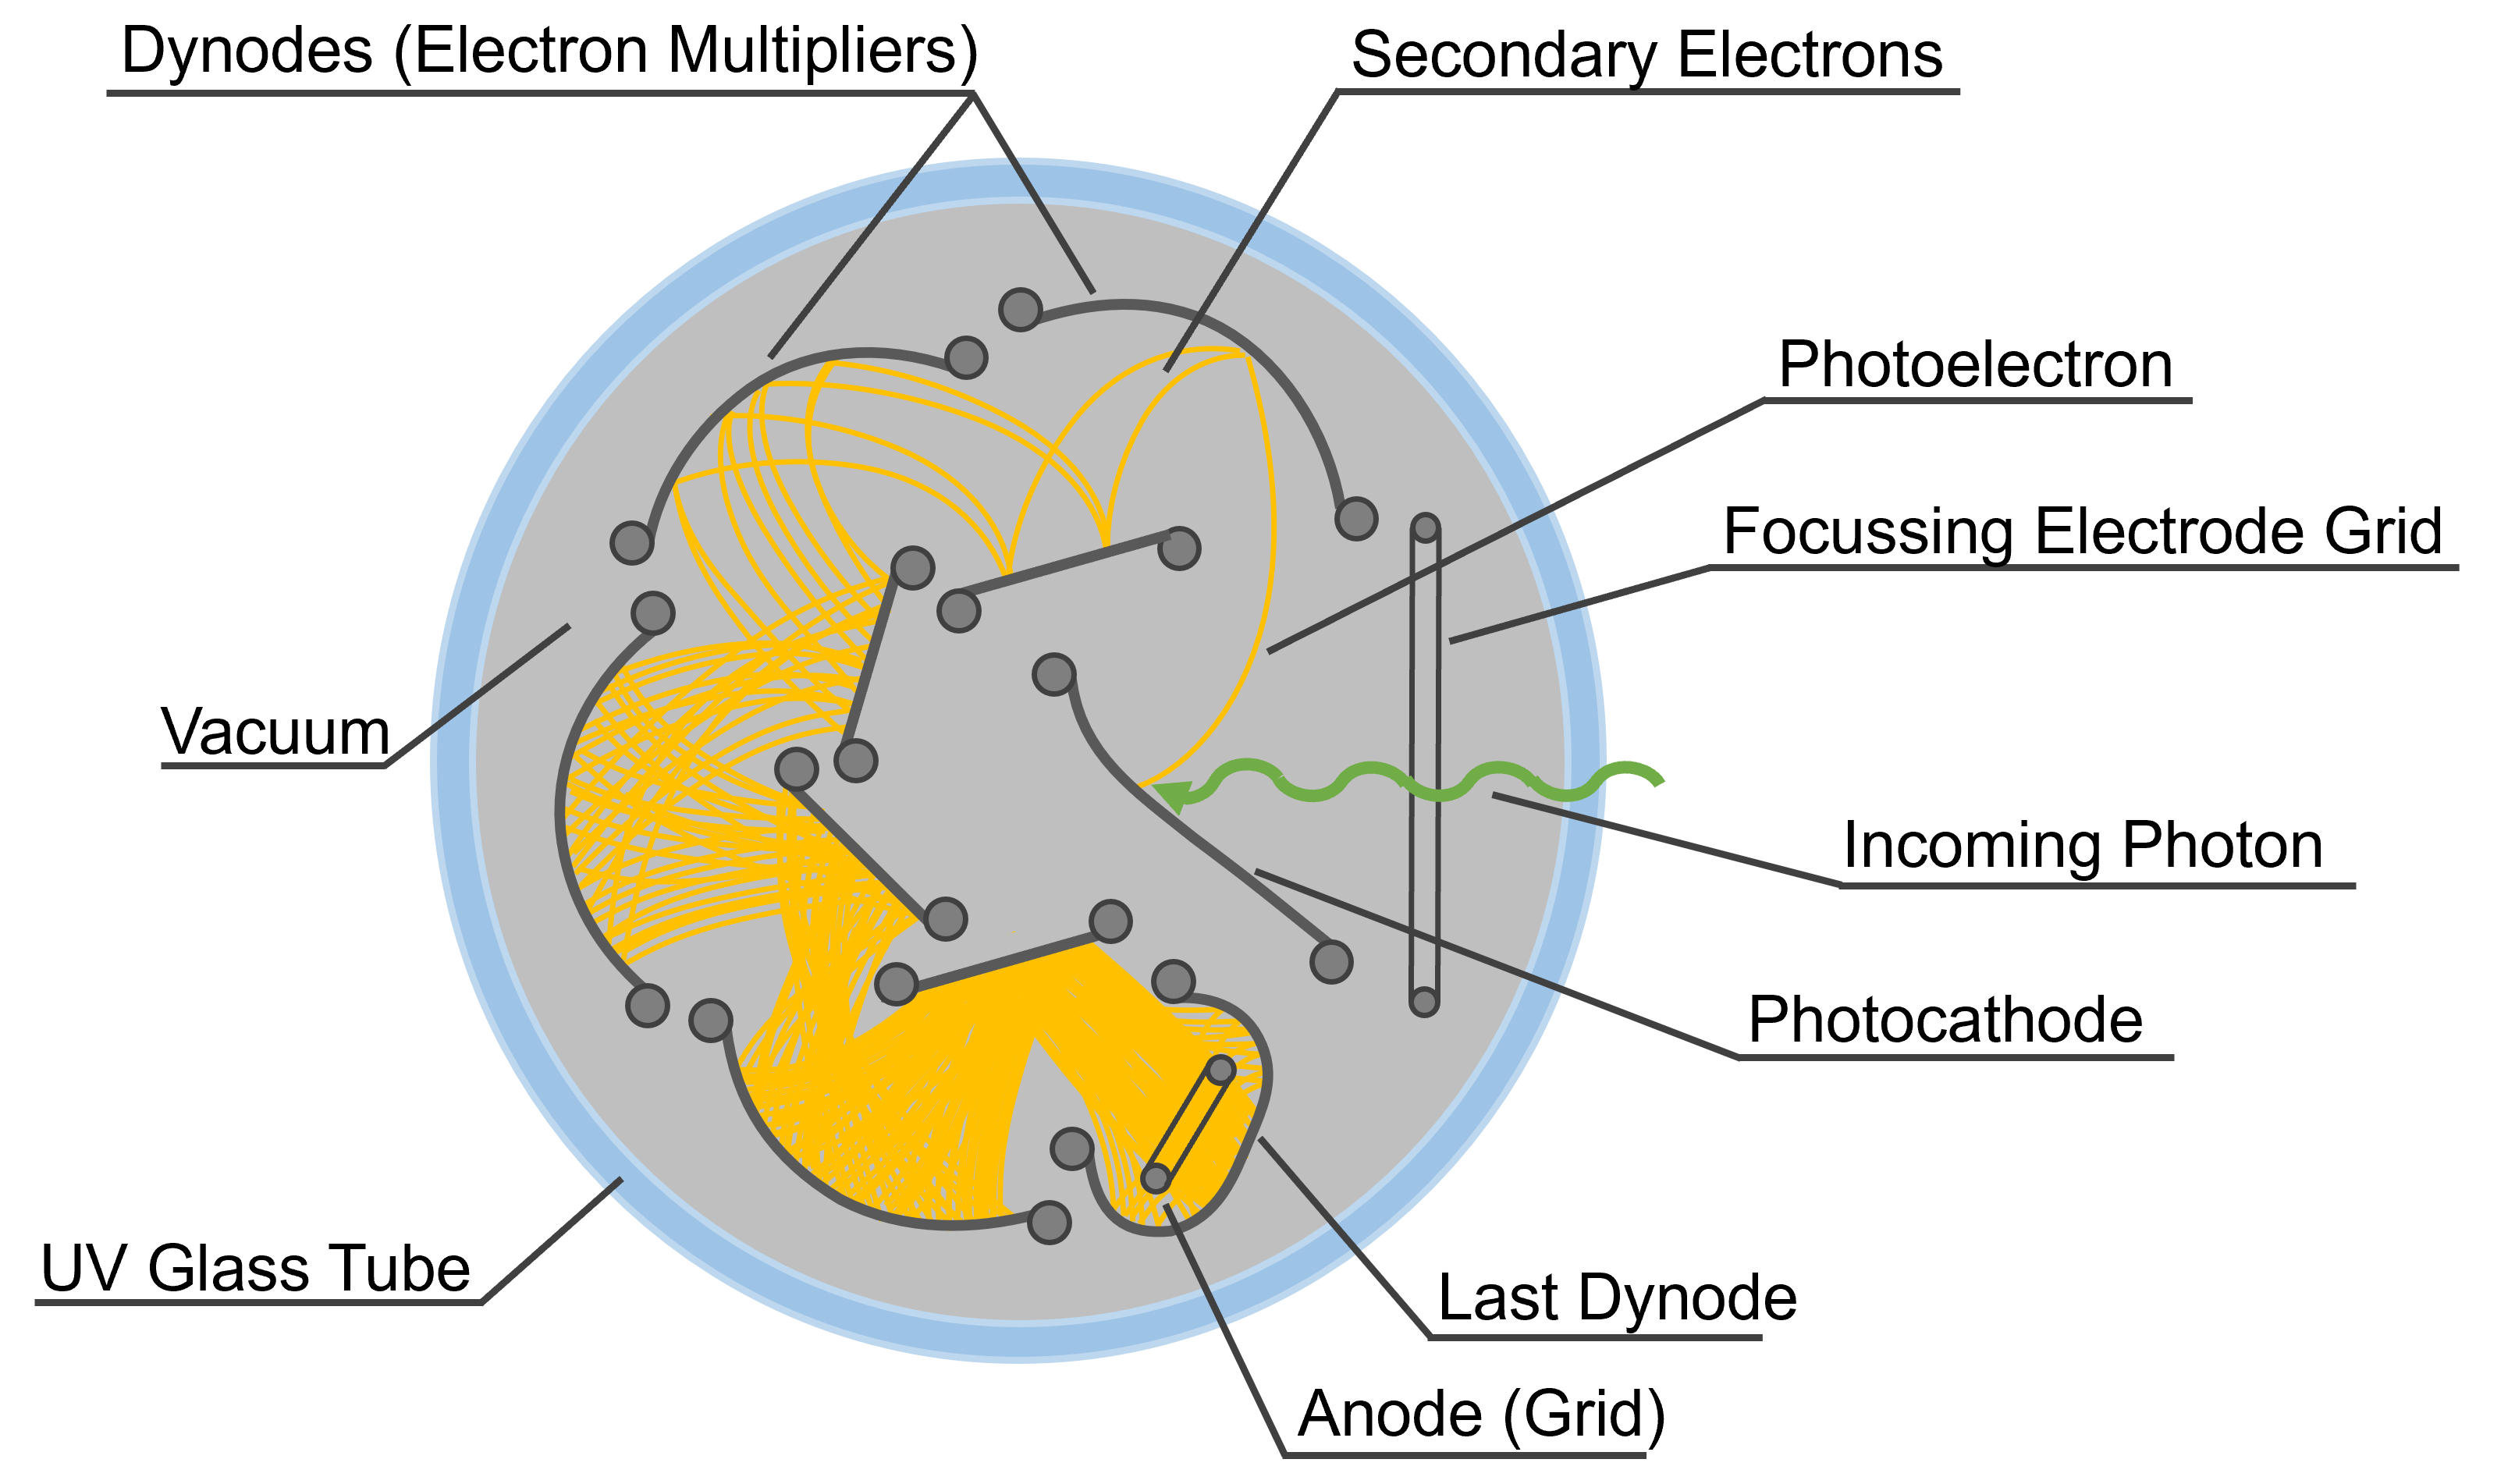
Figure 6. How a Photomultiplier Tube Works.
Now that the key components of a fluorescence spectrometer have been explained, what can you do with them? As the name suggests, the primary purpose of a fluorescence spectrometer is to measure fluorescence spectra. There are two main types of fluorescence spectra: excitation and emission.
Fluorescence Emission Spectrum
In a fluorescence emission spectrum, the sample is excited at a constant excitation wavelength and the emission monochromator is scanned and the fluorescence intensity is recorded as a function of emission monochromator wavelength. In the Coumarin 153 emission spectrum below the excitation monochromator wavelength was set to 400 nm and the emission monochromator was scanned from 420 nm to 750 nm. This is by far the most common type of spectra and when someone writes ‘fluorescence spectrum’ this is what they mean.
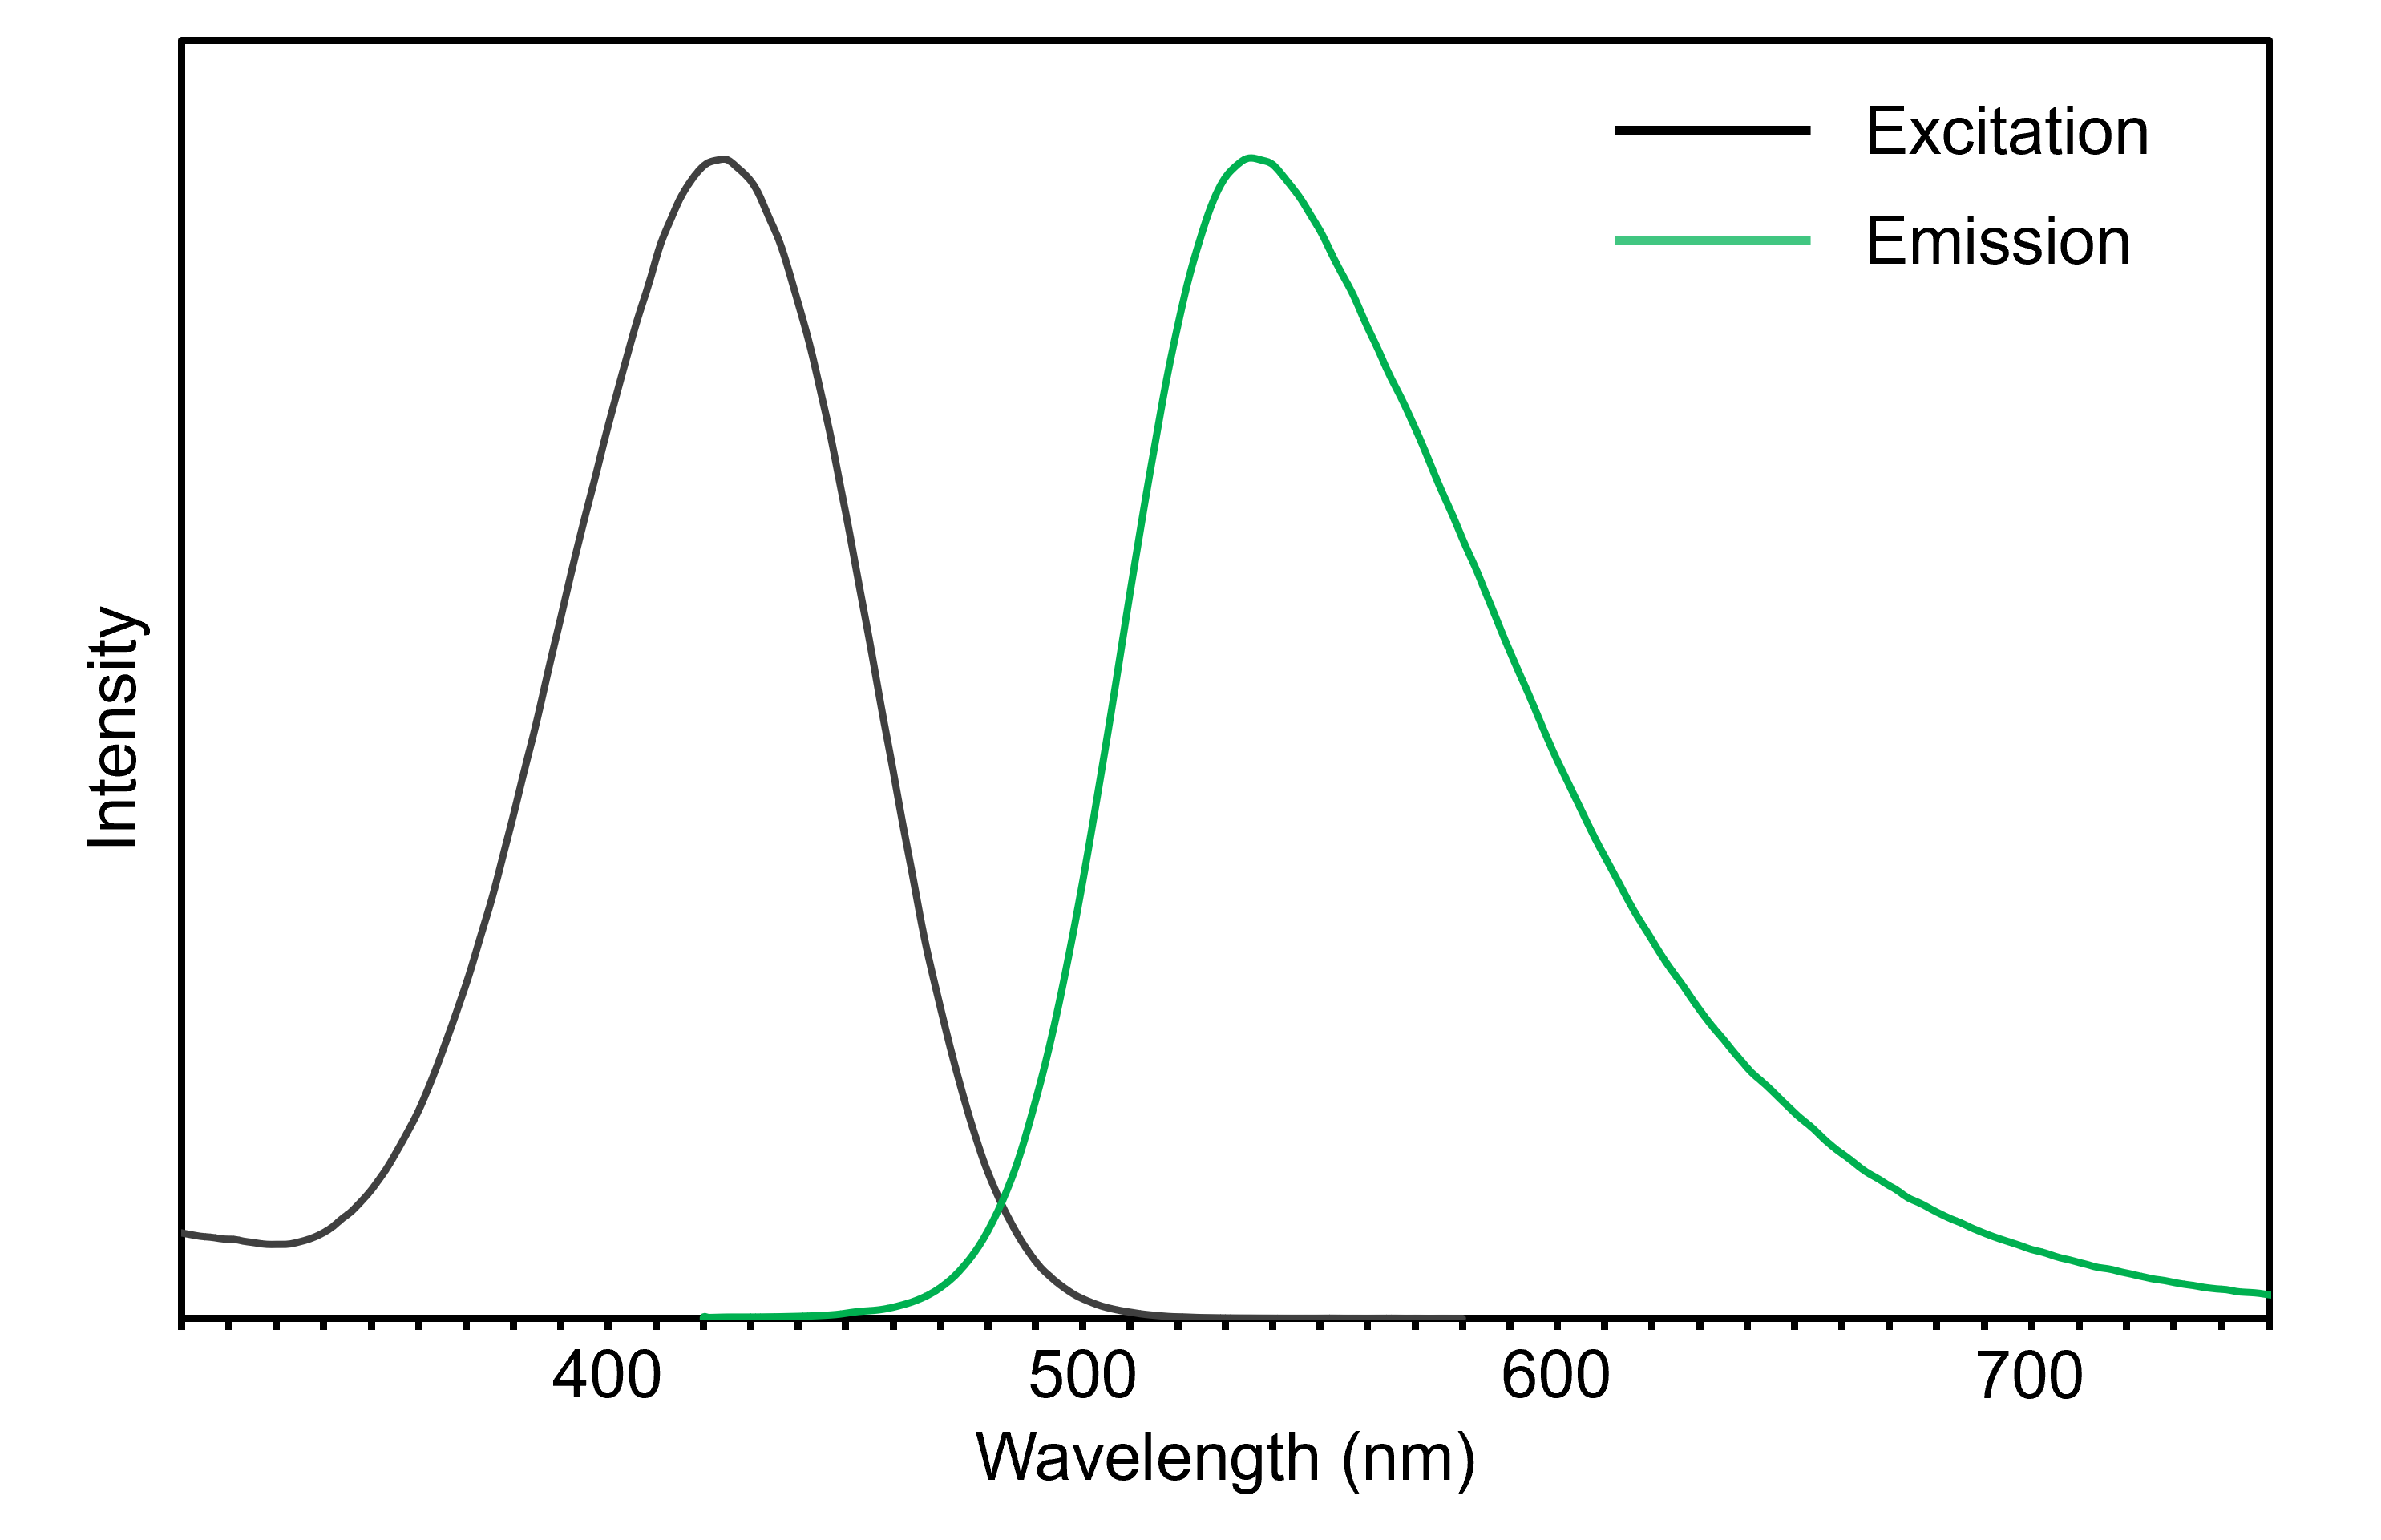
Figure 7. Excitation and Emission Spectra of Coumarin 153 measured using the FS5 Spectrofluorometer.
Fluorescence Excitation Spectrum
In a fluorescence excitation spectrum, the emission monochromator is set at a constant wavelength and the excitation monochromator is scanned and the fluorescence intensity is recorded as a function of excitation monochromator wavelength. In the Coumarin 153 excitation spectrum above the emission monochromator wavelength was set to 600 nm and the excitation monochromator scanned from 310 nm to 520 nm. Excitation spectra can be used to identify the correct excitation wavelength for emission spectra and laser excitation wavelengths for fluorescence lifetime measurements. For classic fluorescence dyes with one emitting excited state that obey Kasha’s and Vavillov’s Rules, excitation spectra provides equivalent information as absorption spectra.
Would you like to hear how the FLS1000 and the FS5 can benefit your research? Contact our team today to learn more!