In this Spectral School tutorial, the differences between molecular absorption, excitation and emission spectra are explained.
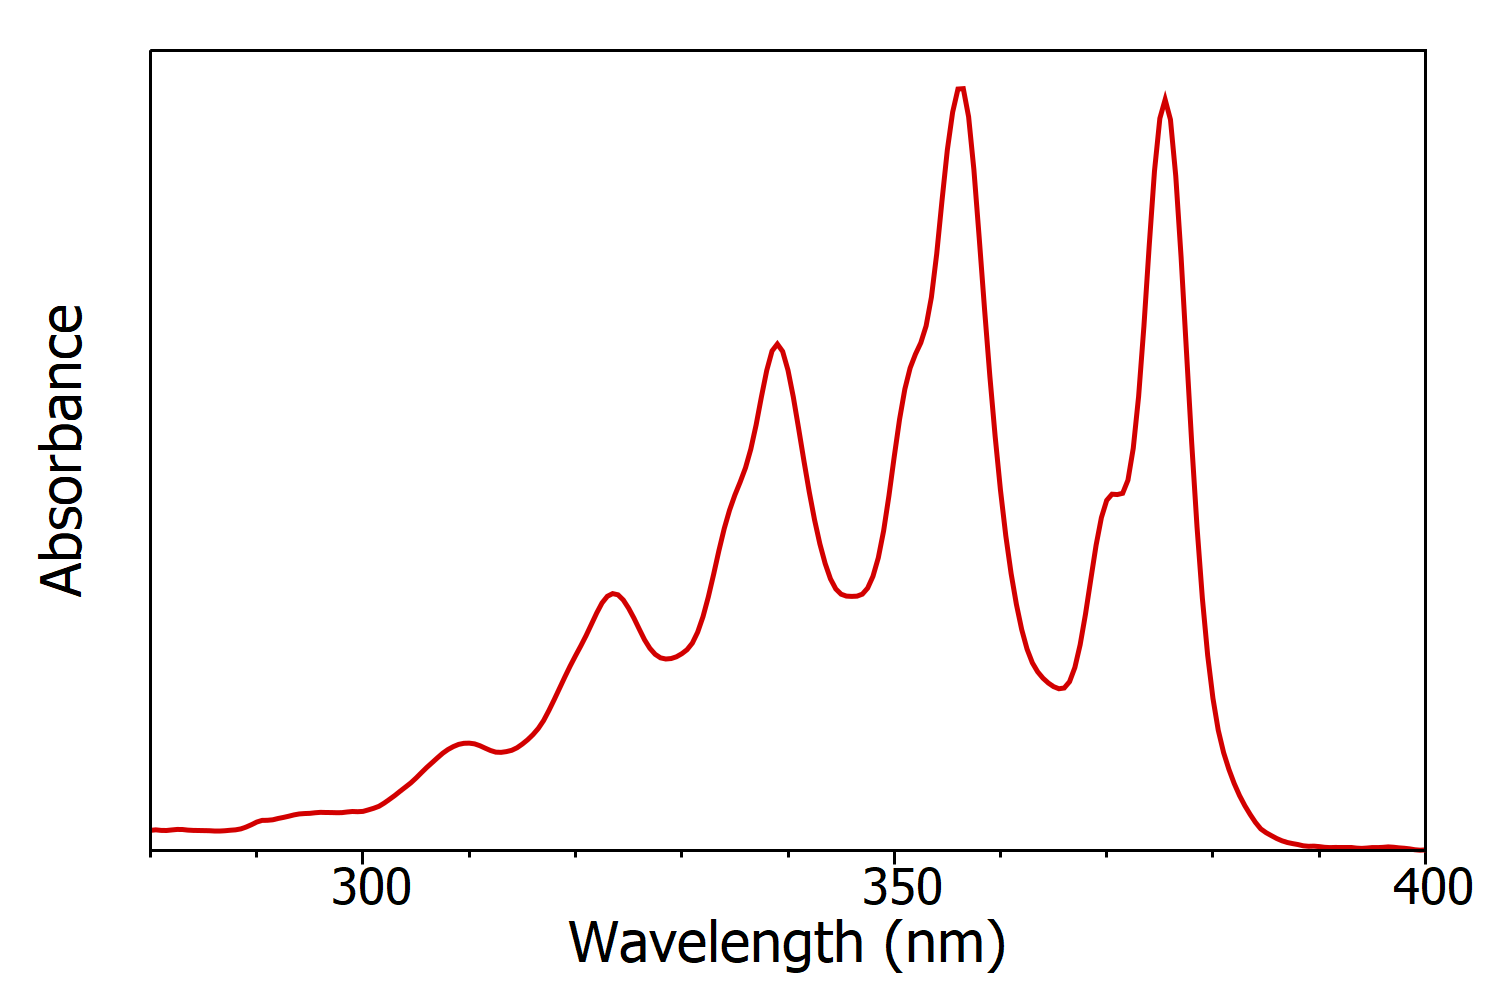
Figure 1: Absorption spectrum of anthracene in cyclohexane measured using the FS5 Spectrofluorometer. Experimental parameters: Δλ = 1 nm.
Absorption spectra (also known as UV-Vis spectra, absorbance spectra and electronic spectra) show the change in absorbance of a sample as a function of the wavelength of incident light (Figure 1), and are measured using a spectrophotometer. Absorption spectra are measured by varying the wavelength of the incident light using a monochromator and recording the intensity of transmitted light on a detector. The intensity of light transmitted through the sample, ISample, (such as an analyte dissolved in solvent) and the intensity of light through a blank, IBlank, (solvent only) are recorded and the absorbance of the sample calculated using:

The absorbance is linearly proportional to the molar concentration of the sample; which enables the concentration of the sample to be calculated from the absorption spectrum using the Beer-Lambert Law.

Figure 2: Schematic of the measurement of absorption spectra in a spectrophotometer.

Figure 3: Fluorescence excitation spectrum of anthracene in cyclohexane measured using the FS5 Spectrofluorometer. Experimental parameters: λem = 420 nm, Δλem = 1 nm, Δλex = 1 nm.
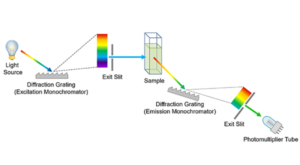
Fluorescence excitation spectra show the change in fluorescence intensity as a function of the wavelength of the excitation light (Figure 3), and are measured using a spectrofluorometer. The wavelength of emission monochromator is set to a wavelength of known fluorescence emission by the sample, and the wavelength of the excitation monochromator is scanned across the desired excitation range and the intensity of fluorescence recorded on the detector as a function of excitation wavelength. If the sample obeys Kasha’s Rule and Vavilov’s Rule then the excitation spectrum and absorption spectrum will be identical (compare Figures 1 and 3). Excitation spectra can therefore be thought of as fluorescence detected absorption spectra.
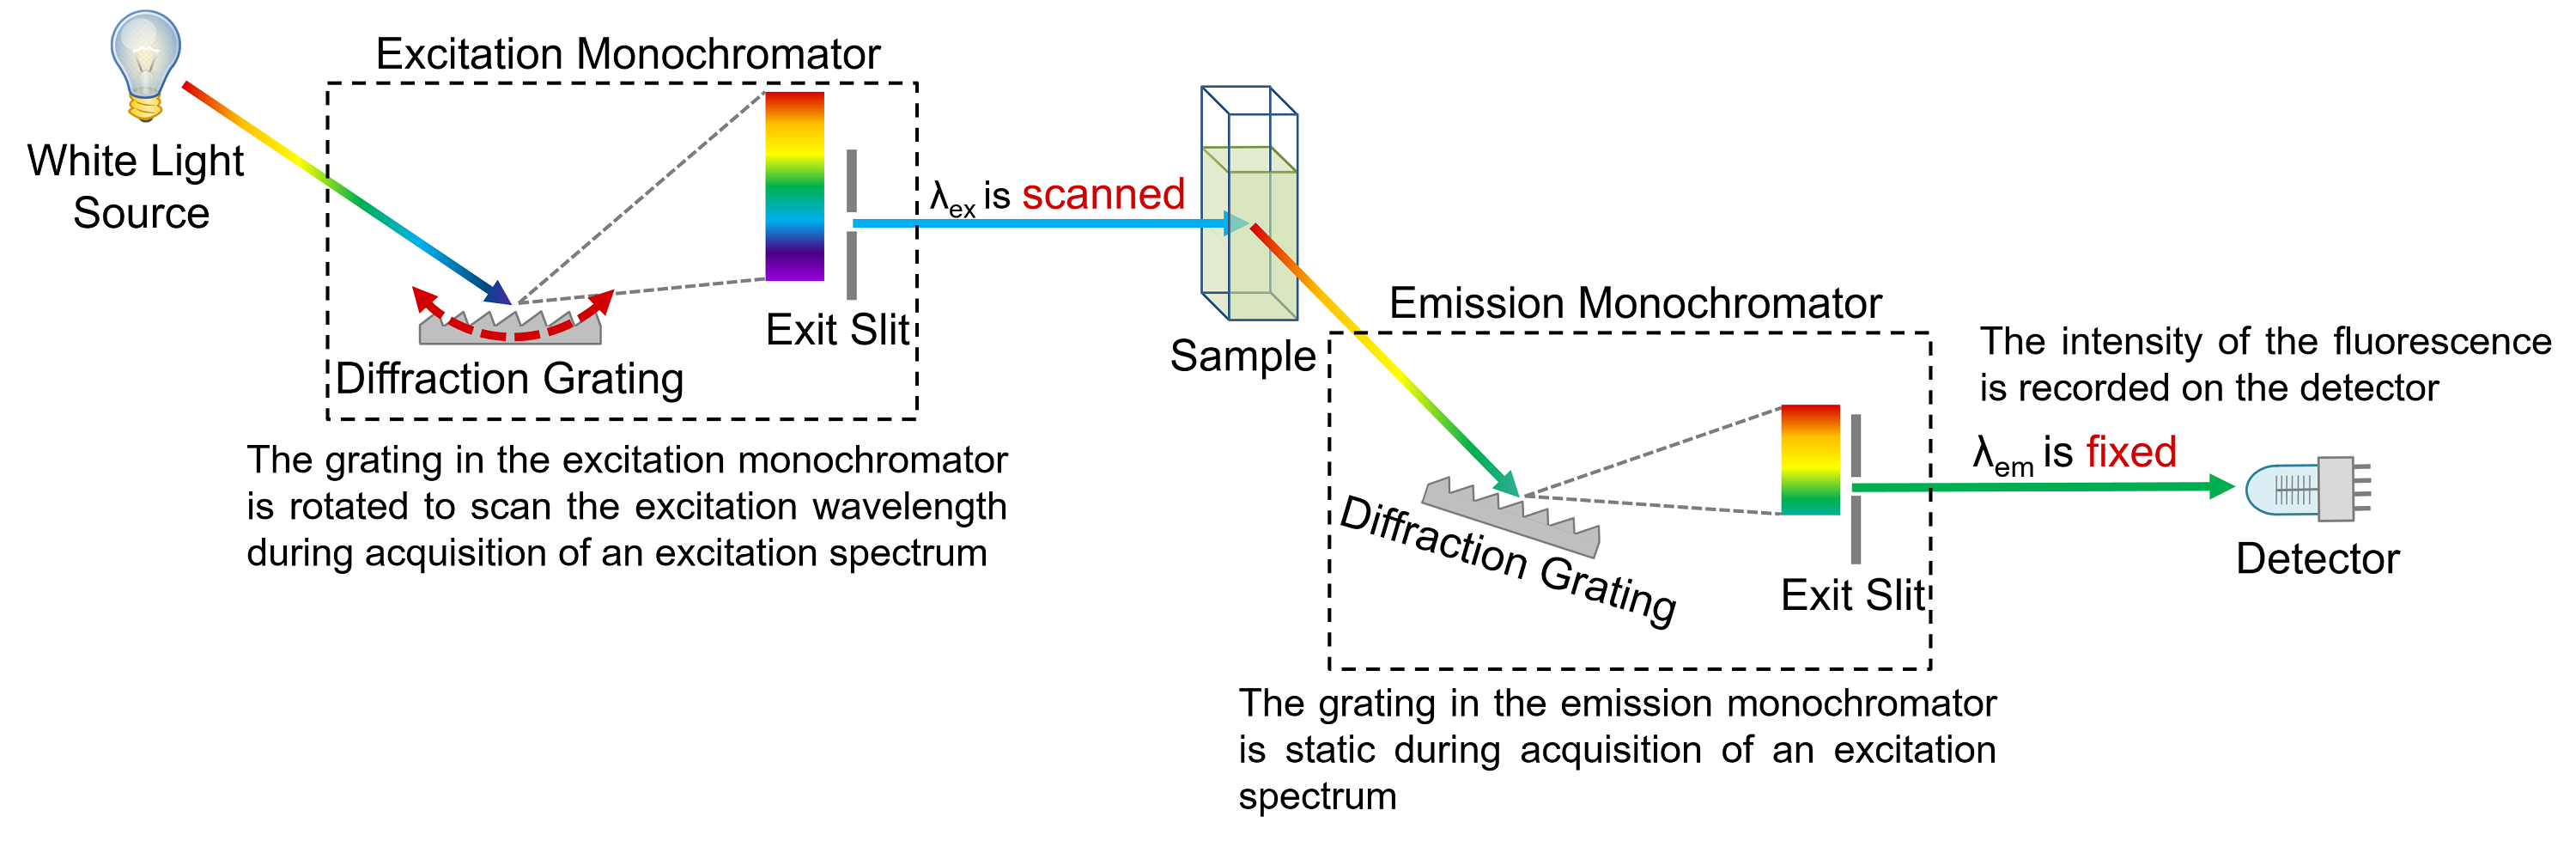
Figure 4: Schematic of the measurement of excitation spectra in a spectrofluorometer.

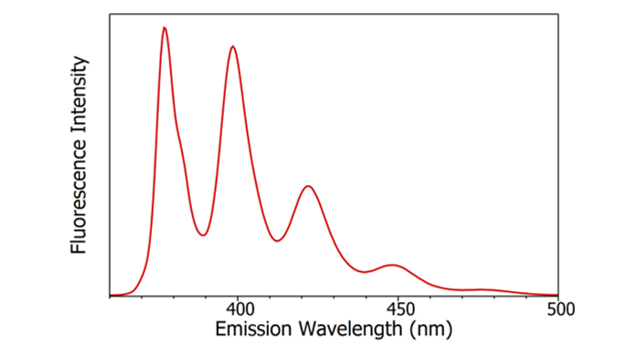
Figure 5: Fluorescence emission spectrum of anthracene in cyclohexane measured using the FS5 Spectrofluorometer. Experimental parameters: λex = 340 nm, Δλex = 1nm, Δλem= 1 nm
Fluorescence emission spectra show the change in fluorescence intensity as a function of the wavelength of the emission light (Figure 5), and are measured using a spectrofluorometer. The wavelength of excitation monochromator is set to a wavelength of known absorption by the sample, and the wavelength of the emission monochromator is scanned across the desired emission range and the intensity of the fluorescence recorded on the detector as a function of emission wavelength.

Figure 6: Schematic of the measurement of emission spectra in a spectrofluorometer.