In this Spectral School tutorial we discuss how to identify the presence of Raman scattering during fluorescence measurements and how to prevent this scattering from distorting fluorescence emission spectra.
When a fluorescent sample is excited in a spectrometer, four processes can occur to the photons of the excitation light: absorbed by the sample and remitted as fluorescence, transmitted through the sample, scattered elastically, or scattered in-elastically which is more commonly known as Raman scattering. Since this a blog on fluorescence spectroscopy, an accurate spectrum of the fluorescence emission is the desired outcome while preventing the two scattering processes from distorting the spectrum.

Figure 1: Fluorescence, elastic scattering and Raman scattering processes.
In elastic scattering (which can also be called Rayleigh, Mie or geometric scattering depending on the relative size between the wavelength of the excitation light and the scattering particles) the energy of the photon is conserved and the wavelength of the scattered light is therefore equal to the excitation light. Elastic scattering therefore always occurs at a shorter wavelength than the fluorescence emission. It is therefore possible to prevent the elastic scatter from distorting the fluorescence spectrum through a sensible choice of the excitation wavelength; namely, a wavelength shorter than the shortest wavelength of the fluorescence emission.
In a Raman scattering process the energy of the photons are not conserved and they can either lose energy (Stokes scattering) or gain energy (anti-Stokes scattering) to or from the vibrational energy of the scattering molecule. Due to this energy change, the wavelength of Stokes Raman scattering can overlap with the fluorescence and distort the measured spectrum. Raman scattering from a fluorophore is typically much weaker than the fluorescence, and Raman interference is therefore never an issue when measuring the fluorescence spectra of solid samples. However, the situation is very different when measuring the emission of a fluorophore in solution. In solution the molarity of the fluorophore is many orders of magnitude less than the molarity of the solvent. Due to this large difference in molarity, the Raman scatter from the solvent molecules can be comparable or even larger than the fluorescence from the fluorophore, which can result in the distortion of the measured fluorescence spectrum.
To illustrate the problem that Raman scattering can cause, the fluorescence spectrum of a dilute solution of fluorescein in aqueous PBS buffer (pH 7) was measured using the FLS1000 (Figure 2). The fluorescein solution was excited at 450 nm and it can be seen that the measured spectrum has a peak at 532 nm. Fluorescein is an extensively used molecule and an experienced fluorescence spectroscopist will therefore immediately realise that the spectrum in Figure 2 is incorrect. However, if this was an unknown compound being measured there is a risk that that measured spectrum is assumed to be the true fluorescence spectrum of the new compound. In reality the peak at 532 nm is the Raman scattering peak of water when excited at 450 nm, which is superimposed atop the fluorescence emission from the fluorescein. The example here is with water but every solvent has a Raman scattering peak that can distort fluorescence spectra.

Figure 2: Fluorescence spectrum of a dilute solution of fluorescein in PBS buffer (pH 7) measured using the FLS1000 Photoluminescence Spectrometer. λex = 450 nm, Δλex = 3 nm, Δλem = 3 nm.
The classic way to check whether a peak is part of the fluorescence spectrum or a Raman artefact is to vary the excitation wavelength. Fluorescence and Raman scattering are fundamentally different processes and respond differently to changing the excitation wavelength. In fluorescence, the incoming photon is absorbed and the molecule promoted to an electronic excited state, where it remains for a finite amount of time before relaxing to the ground state and re-emitting a photon at a longer wavelength. Fluorescence emission (almost) always occurs from the 1st electronic excited state of the molecule (Kasha’s rule) as the molecule relaxes from the higher electronic excited states to the 1st electronic excited state quicker than it can fluoresce. The fluorescence emission is therefore independent of the excitation wavelength and the spectrum will not shift as the excitation wavelength is varied.
In contrast, Raman is a scattering process and the wavelength of the scattered photon is proportional to the wavelength of the excitation photon. The relationship between the wavelength of the Raman scatter and the excitation wavelength is,

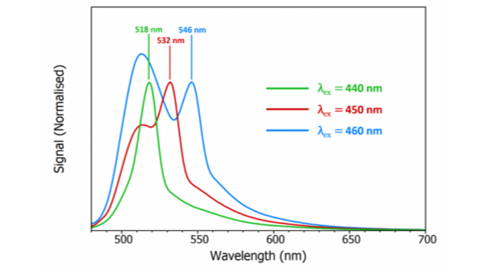
where ν is the Raman shift which is around 3400-3600 cm-1 for water. As the wavelength of the excitation light is increased, the wavelength of Raman scatter will also increase and this can be used to distinguish between Raman and fluorescence. Figure 3 shows the spectra of fluorescein measured at three different excitation wavelengths where it can be seen that the wavelength of the peak shifts with excitation wavelength which confirms that the peak must be due to Raman scattering. This simple test of changing the excitation wavelength should always be done if Raman scattering is suspected.

Figure 3: Fluorescence spectra of a dilute solution of fluorescein in PBS buffer (pH 7) measured using the FLS1000 Photoluminescence Spectrometer at three different excitation wavelengths. λex =440, 450, 460 nm, Δλex = 3 nm, Δλem = 3 nm.
Now that we have identified that the spectrum is distorted due to Raman scattering, the question remains on how to measure the true spectrum of the fluorescein. There are two ways in which this can be done in a steady state spectrometer. The first option is to lower the excitation wavelength such that that the Raman peak is shifted to lower wavelengths and further away from the fluorescence emission that is to be measured. The success of this method depends on the absorption profile of the fluorophore and the Stokes shift between the absorption and fluorescence. In molecules with a narrow absorption profile and small Stokes shift the excitation wavelength may not be able to be shifted to a short enough wavelength to prevent overlap of the Raman scatter and the fluorescence. This is the case for fluorescein which has very weak absorption below 400 nm which prevents the excitation wavelength from being moved to sufficiently low wavelengths for this method to work.
The second approach is to measure the emission of the fluorophore in solution and then measure the emission from the pure solvent that was used to make the solution. The solvent only spectrum can then be subtracted from the solution spectrum to give the true spectrum of the fluorophore without any Raman artefacts. For this approach to work the measurement conditions between the two spectra need to be as close as possible. The same experimental parameters (bandwidth, step size, integration time etc.) should therefore be used for both measurements. In addition, the two cuvettes used should be as identical as possible to avoid any differences in transmission between the cuvettes. It is also crucial that the excitation intensity used in the two measurements is the same. Most spectrometers use Xenon arc lamps as the excitation source and the power of these lamps tend to fluctuate with time; for example due to temperature drifts in the room. For this reason Edinburgh Instruments spectrometers are equipped with a reference detector to continuously monitor the lamp intensity. Excitation reference correction can then be applied to measured spectra to account for changes in lamp intensity between or during measurements.

Figure 4: Emission spectra of fluorescein solution and PBS buffer (pH 7) measured using the FLS1000. λex = 450 nm, Δλex = 3 nm, Δλem = 3 nm. The spectra of the solution and the solvent blank were corrected to account for changes in excitation intensity between the measurements and to account for the emission monochromator and detector wavelength response.
The spectrum of the fluorescein solution and PBS buffer when excited at 450 nm are shown in Figure 4. It can be seen that the PBS buffer spectrum is simply the Raman scattering peak of water at 532 nm. Excitation reference correction was used to account for any difference in excitation intensity between the two measurements, ensuring the relative intensities of the two spectra are accurate. The PBS buffer spectrum was subtracted from the fluorescein solution spectrum using the FLS1000’s Fluoracle operating software to give the true spectrum of fluorescein which is shown in Figure 5.

Figure 5: True spectrum of fluorescein in PBS buffer (pH 7) after subtraction of the solvent background. λex = 450 nm, Δλex = 3 nm, Δλem = 3 nm. The spectra of the solution and the solvent blank were corrected to account for changes in excitation intensity between the measurements and to account for the emission monochromator and detector wavelength response.
Stay up-to-date with the latest news, applications, and product information from Edinburgh Instruments by following us on social media, and by signing up to our infrequent newsletter via the red sign-up button below.