Fluorescence anisotropy, also known as fluorescence polarisation, uses polarised light to measure the rotation of a molecule between absorption and emission of photons.1 By analysing this rotation, we can gain insights into the movement and orientation of a molecule, which are important for understanding its physical and chemical properties. This technique can be applied to investigate various molecular characteristics, including electronic structure, solvent interactions, macromolecular conformation, binding dynamics, and protein interaction. This makes it an especially useful tool in the fields of biochemistry and biophysics.
Molecules in a sample are constantly rotating, moving and colliding with each other; this phenomenon is called Brownian motion (Figure 1).2 The intensity of Brownian motion is influenced by factors such as temperature, particle size and fluid viscosity. Small particles exhibit more pronounced Brownian motion compared to larger molecules and therefore move and rotate faster. This is due to the increased impact of random collisions with solvent molecules on smaller particles.
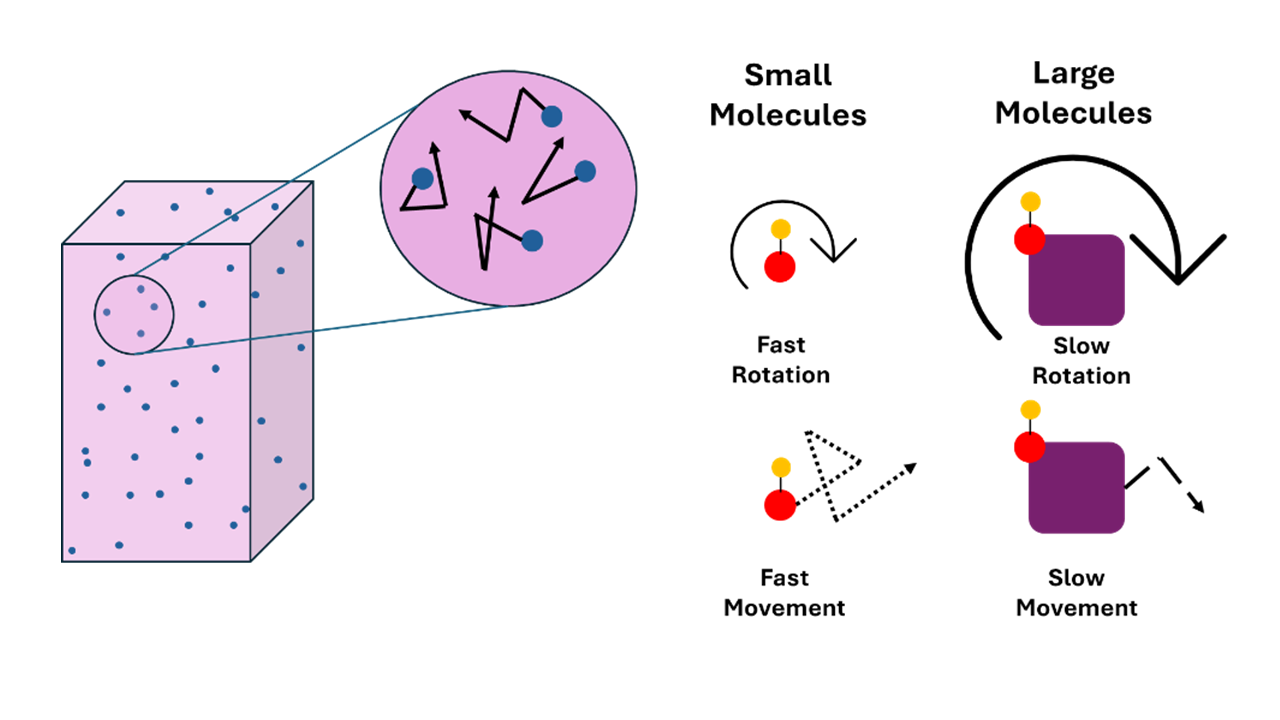
Figure 1. Brownian motion describes the random movement of particles suspended in a liquid or gas. Small molecules move and rotate faster than large molecules due to the larger transfer of momentum in solution.
Fluorescence anisotropy measures the motion of a molecule using polarised light. When a sample is excited by polarised light, the fluorophores will rotate between the time of excitation and time of emission, the rotation will occur over pico- to nanoseconds. This rotation means that the emitted light oscillates in all directions and is depolarised compared to the excitation light. The degree of depolarisation, expressed as anisotropy, is proportional to this motion and is therefore dependent on the rotational mobility of the molecule.
Fluorophores with restricted mobility, such as larger molecules, or those in viscous solutions, show higher anisotropy. Molecules that rotate freely, such as smaller molecules, or those in less viscous solutions, exhibit lower anisotropy values. The rotational relaxation time is an indicator of properties such as size of molecule, solvent interactions, aggregation and binding state.
Every fluorophore has an absorption transition dipole moment. Upon excitation with polarised light, those molecules whose absorption transition moments align with the electric vector of the incident light are preferentially excited. This phenomenon is known as photoselection.3 On the other hand, molecules with perpendicular dipoles remain in the ground state.
The rule of photoselection results in varying emission intensities within the sample population due to the random orientation of molecules in solution.
In fluorescence anisotropy, the sample is excited using linear polarised light. Linear polarisation of light occurs when the electric field of the light oscillates in a single plane perpendicular to the direction of the light’s propagation. This is achieved using a polariser, as shown in Figure 2.4
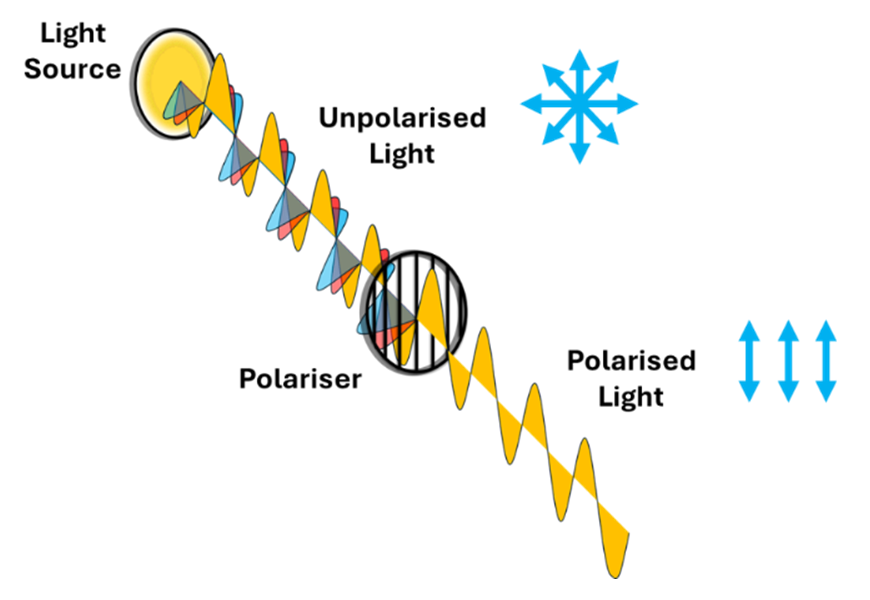
Figure 2. Polarisation of light using a linear polariser. Arrows (blue) show the electric field oscillation direction of the light.
The experimental set-up for measuring fluorescence anisotropy is shown in Figure 3. The steps for measuring fluorescence anisotropy are:
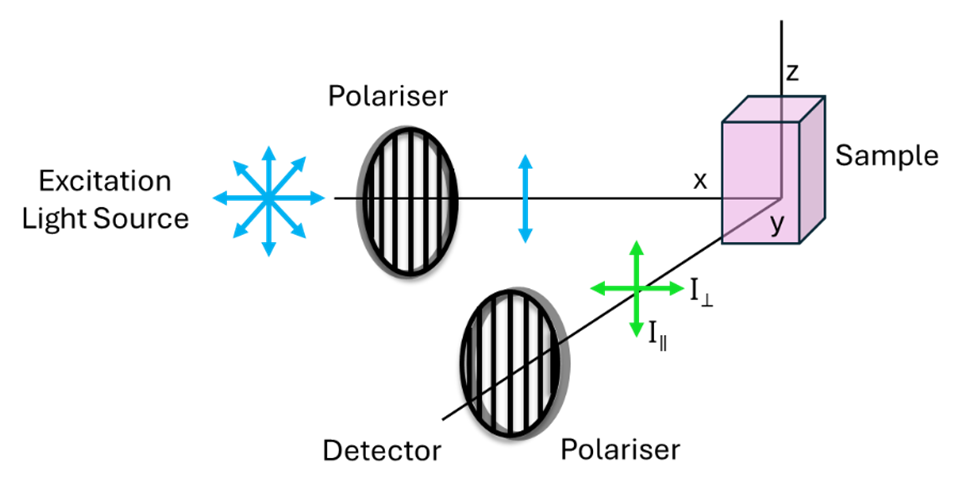 Figure 3. Schematic of experimental setup for fluorescence anisotropy measurements.1
An example fluorescence anisotropy measurement is shown in Figure 4. The raw spectra collected with the vertical polariser and the horizontal polariser (left) are used to calculate the fluorescence anisotropy (right).
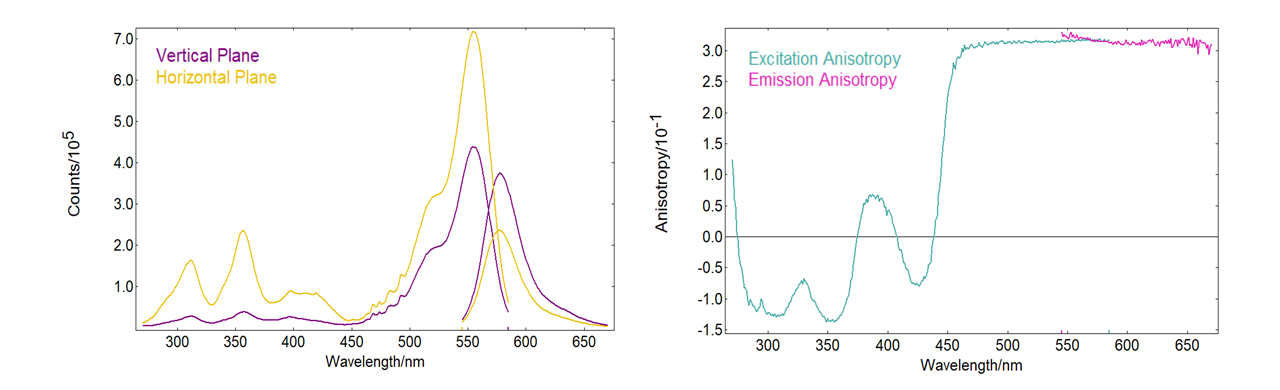
Figure 4. Fluorescence anisotropy measurements taken using an Edinburgh Instruments FS5 spectrometer with FS5-POL upgrade. Left: Fluorescence anisotropy measurement of Rhodamine 6G in glycerol at room temperature. Raw data for vertical (purple) and horizontal (yellow) emission polarisation plane. Right: Steady state anisotropy of excitation (blue) and emission (magenta).
The raw spectra themselves depict both excitation and emission measurements. The excitation spectrum is generated by scanning the excitation wavelength while keeping the emission wavelength fixed. In contrast, the emission spectrum is recorded by scanning the emission wavelength while maintaining a constant excitation wavelength. This approach allows for the calculation of both excitation and emission anisotropy.
As mentioned, the measured intensity of the emitted light parallel and perpendicular to the excitation polarisation is used to calculate the fluorescence anisotropy.5 The fluorescence anisotropy, r, is defined as:
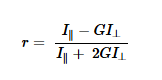
In this equation, I∥ describes the fluorescence intensity parallel to excitation and I⊥ describes the fluorescence intensity perpendicular to excitation. Additionally, G is the grating factor or G factor, which corrects for the polarisation sensitivity of optical components like filters, gratings, and monochromators.
The calculated anisotropy is independent of the total fluorescence intensity of the sample because the difference of intensity in parallel and perpendicular planes is normalised by total intensity (IT), described by IT = I∥ + 2I⊥. This means that anisotropy is independent of the fluorophore concentration, making it an independent fluorescent property alongside steady state emission and lifetime measurements.
Time-resolved fluorescence anisotropy, measured using pulsed laser excitation and time-correlated single photon counting (TCSPC), can also offer deeper insights into the dynamics of fluorophore interactions. However, a limitation of time-resolved fluorescence anisotropy is that it provides time-averaged values, potentially obscuring dynamic processes.
The degree of light polarisation of a fluorophore is inversely proportional to Brownian motion. This means that fluorescence anisotropy is affected by all parameters that alter the rotation and random movement of a molecule. The parameters affecting anisotropy are described in Table 1.
Table 1. Factors which affect fluorescence anisotropy.
Sample Parameter Fluorescence Anisotropy Effect Molecular size and shape Larger molecules rotate more slowly, leading to higher anisotropy values. Solvent viscosity A more viscous solvent hinders molecular rotation, increasing anisotropy. Temperature Higher temperature increases molecular motion and rotation, reducing anisotropy. Molecular interactions Interactions with other molecules can affect rotation and, consequently, anisotropy.
Fluorescence anisotropy is a versatile technique with a wide range of applications in biochemistry and biophysics.6 One common application is the fluorescence polarisation immunoassay (FPIA), which is a rapid detection assay for antibodies and antigens in a sample (Figure 5).7
In FPIA, a fluorescent dye, specific to a target antigen or antibody, binds to the target if present. When the sample is excited with polarised light, smaller molecules (like the unbound fluorescent dye) rotate faster in solution than larger ones (like the antigen or antibody). When the smaller fluorescent molecule binds to the larger target, their angular momentum combines. Their combined rotation is slower than that of the small molecule alone. This change in rotation time, indicative of molecular size, confirms the binding event.
By detecting this binding, FPIA can confirm the presence of the target antigen or antibody in the sample.
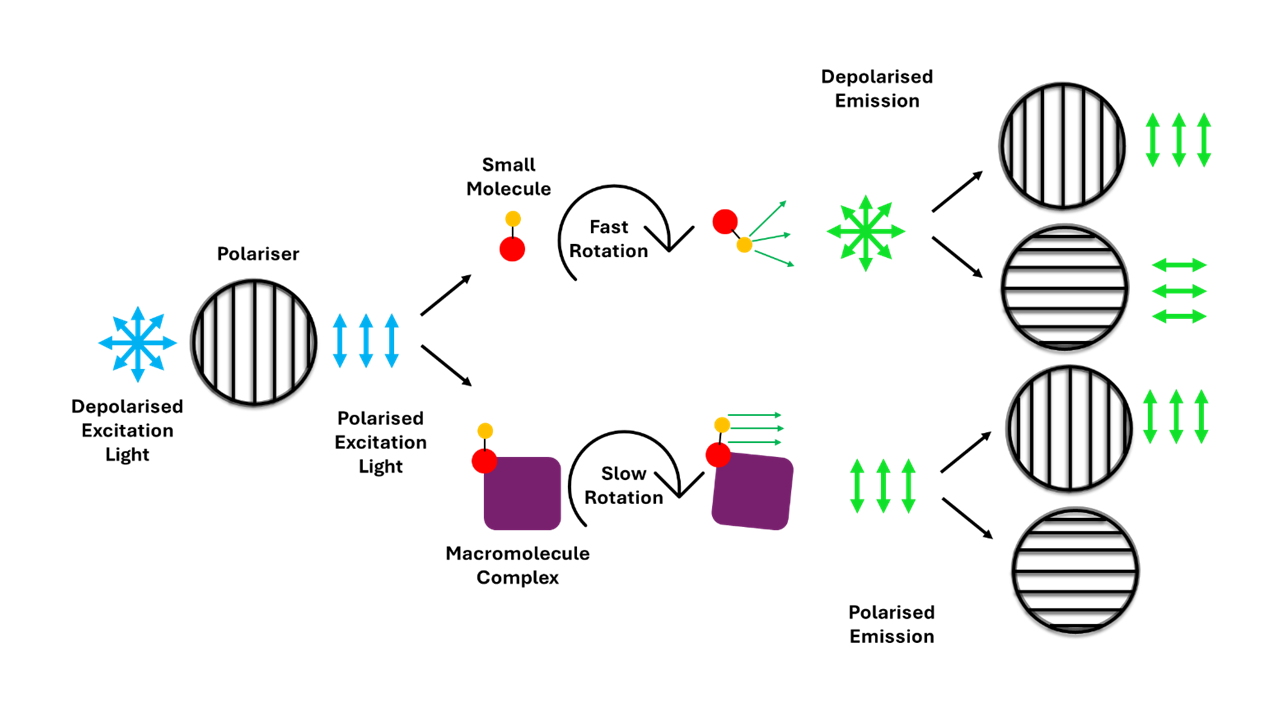
Figure 5. Example of a fluorescence anisotropy assay for monitoring molecular binding between a small and large molecule. This process is the idea behind the FPIA for rapid detection of antibodies and antigens.
Other applications of fluorescence anisotropy include:
By understanding the principles of fluorescence anisotropy, researchers can gain valuable insights into the structure, dynamics, and interactions of molecules in solution.