Fourier Transform Photoluminescence (FT-PL) spectrometers are modified to overcome the problems associated with measuring photoluminescence on a non-dispersive instrument. In this technical note, we discuss how the IR5 Benchtop FTIR spectrometer can be equipped with a FT-PL accessory and the resulting spectra.
Mid-infrared photoluminescence (MIR PL) spectroscopy is widely used to characterise semiconductors and MIR-emitting materials for lasers and light sources. There are various definitions of the MIR spectral range but MIR PL occurs typically in the range of ~2 µm – 25 µm.
There are two experimental approaches to measuring PL spectra: dispersive and non-dispersive. Dispersive instrumentation separates the light into individual wavelengths before detecting it, usually with a monochromator containing a diffraction grating. PL spectrometers operating in the visible spectral range utilise this approach.
Non-dispersive instruments feature an interferometer instead of a monochromator and are usually Fourier Transform Infrared (FTIR) spectrometers modified for PL spectroscopy, or Fourier Transform Photoluminescence (FT-PL) spectrometers. The interferometer records the entire spectrum at once by creating and analysing an interference pattern between two beams. Figure 1 illustrates the difference between dispersive and non-dispersive PL spectrometers.

Figure 1: Operating principle of a dispersive (monochromator-based) and a non-dispersive (interferometer-based) PL spectrometer.
Most PL applications involve detecting visible light; therefore, PL spectrometers are often dispersive, monochromator-based instruments. When it comes to measuring PL in the MIR, it is common to adapt an existing PL spectrometer with IR detectors and gratings. In this range however FT-PL can provide higher sensitivity results thanks to a series of instrumental advantages:
Dispersive instruments have a slit whose width sets the spectral resolution of the instrument. Light that is rejected by the slit is lost, reducing the SNR. In FT-PL instruments the resolution is controlled by the travel length of the interferometer. To ensure fully collimated light, a special aperture called a Jacquinot stop is used to limit the size of the source. This stop is round, resulting in higher throughput and therefore higher SNR.
3.The wavenumber advantage
FT-PL instruments record an interferogram in units of centimetres. The Fourier transform results in a spectrum with units of reciprocal centimetres (cm-1), with the spectral band pass across the infrared spectrum of a fixed value in cm-1 units. In contrast, dispersive instruments record the spectrum directly in wavelength units (nm), with the spectral band pass across the infrared spectrum of a fixed value in nm. A fixed Δλ means that, when scanning towards longer wavelengths, the energy window detected becomes progressively smaller, producing smaller signals.
The above advantages explain why Fourier transform is preferable over dispersive instrumentation when measuring PL in the MIR. It is possible to find commercial FT-PL spectrometers; however, they are often complex and costly. In this technical note, a commercial FT-PL system based on a benchtop FTIR spectrometer, the Edinburgh Instruments IR5, is used to measure MIR photoluminescence.
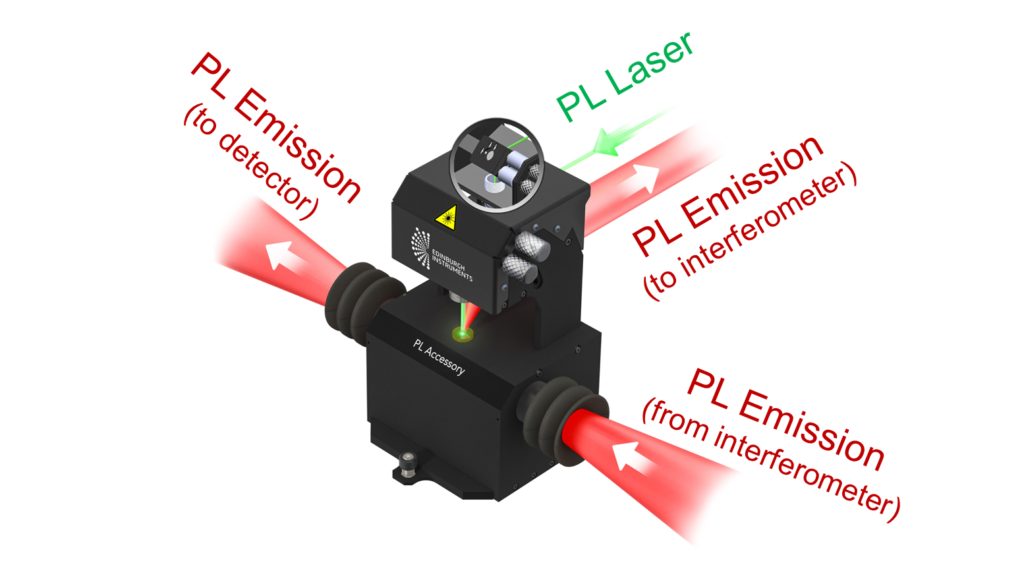
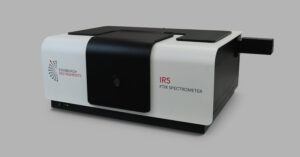
An erbium-containing solid sample was measured in an Edinburgh Instruments IR5 FTIR Spectrometer configured for FT-PL (Figure 2i). The FT-PL upgrade includes a laser mount and steering optics, a dedicated photoluminescence sample holder (Figure 2ii), and optional second detector. The sample was excited with a 2W 980 nm laser, and FT-PL was detected with a liquid nitrogen cooled InSb detector. A spectrum was acquired with the laser off and subtracted from the raw data to remove the thermal background contribution. For comparison, MIR PL from the same sample was measured in a scanning monochromator-based spectrometer equipped with the same laser and an InSb detector.
 Figure 2 (i) Edinburgh Instruments IR5 Spectrometer configured with a laser for FT-PL and (ii) schematic of the Photoluminescence sample holder showing excitation and emission beam paths.
The FT-PL spectrum of the sample acquired with the IR5 is presented in Figure 3. The data was acquired with a spectral resolution of 0.5 cm-1 and averaging 40 consecutive spectra for improved SNR. The total acquisition time was 4 minutes.

Figure 3: Infrared photoluminescence from erbium measured in the IR5 FTIR spectrometer.
Figure 4 presents the MIR PL spectrum of the same sample acquired with a dispersive PL spectrometer. Figures 3 and 4 show uncorrected spectra, i.e. the data has not been corrected for variations in the sensitivity of the InSb detector with wavelength or for absorption by the spectrometer components. It can be seen that the dispersive PL spectrometer in Figure 4 is biased towards lower wavelengths (the Wavenuber advantage in the Introduction), giving lower SNR as it goes further in the MIR. The acquisition time of the spectrum in Figure 4 was also significantly longer, 45 minutes.

Figure 4: Infrared photoluminescence from erbium measured in a monochromator-based PL spectrometer.
In this case the dispersive PL spectrometer acquired data with an emission bandpass of 5 nm and a step size of 1 nm. This means that some of the narrow emission bands of erbium are not well resolved. The IR5 data in contrast provides better spectral resolution and a higher density of points, as shown in Figure 5.

Figure 5: Comparison between PL spectrum obtained in the IR5 spectrometer (green) and in a monochromator-based instrument (red).
The IR5 FTIR spectrometer’s FT-PL upgrade provides excellent quality MIR photoluminescence data in a fraction of the time employed by dispersive PL spectrometers. In addition to the time saving advantage, exposing the sample to the excitation laser for a shorter time can reduce sample photodamage and mitigate the thermal background interference frequently encountered in MIR PL spectroscopy.