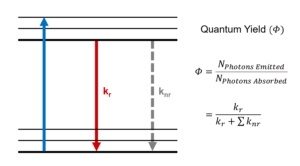
The quantum yield of a fluorophore is a fundamental photophysical parameter defined as the ratio of the number of the emitted to the number of the absorbed photons,1–3

The quantum yield is a direct measure on the efficiency of a material to convert absorbed light into emitted and can be measured optically, using either the relative or absolute method. In this blog post we focus on the relative quantum yield method and explain how the quantum yield of a sample in solution can be calculated by comparing its fluorescence intensity to that of a reference solution of known quantum yield.
The relative quantum yield, фs, of the sample can be calculated using:4
where the subscripts S and R denote the sample and reference respectively. фR is the known quantum yield of the reference standard, I is the integrated fluorescence (more generally photoluminescence) spectrum intensity, A is the absorbance of the solution at the excitation wavelength (λex), and n is the refractive index of the solution solvent.
The fundamental concept of the relative quantum yield method is that the two solutions that have the same absorbance (at λex) can be assumed to be absorbing the same number of photons. By measuring the fluorescence spectra of the two solutions (with identical experimental conditions) the ratio of the integrated fluorescence intensities can be used to scale the quantum yield value of one solution to determine the value of the other.
The three bracketed terms in Eq. 2 are the ratio of the number of fluorescence photons, number of absorbed photons, and the refractive indexes of the two solutions and together these terms correctly scale the quantum yield of the reference standard to calculate the quantum yield of the sample. Details on these three terms and how to determine them are given in the following sections and a complete derivation of Eq. 2 is given in the appendix.
The fluorescence term IS/IR compares number of photons of fluorescence from the sample and reference. IS/IR is the ratio of the integrated fluorescence intensity of the sample and reference solutions, where

and If (λex, λem) is the fluorescence intensity at wavelength λem. IS and IR are obtained by measuring the fluorescence spectra of the sample and reference in a spectrofluorometer (If (λex, λem) versus λem) and integrating the spectrum. This integration can easily be performed using the built-in integration tools of modern spectrofluorometer software.
It is crucial that the fluorescence spectra of the sample and reference are measured using identical experimental parameters (excitation wavelength, excitation bandwidth, emission bandwidth, and integration time). The intensity of fluorescence detected by a spectrofluorometer is dependent on these parameters and only if they are kept identical can the fluorescence intensity of the sample and reference be meaningfully compared.
The fluorescence spectra must also be corrected for the wavelength dependent detection efficiency of the spectrofluorometer. The monochromators and photomultiplier tube (PMT) detectors in a spectrofluorometer have a wavelength dependent efficiency which means that some fluorescence wavelengths are detected more efficiently than others. This instrumental dependence on wavelength must be removed for accurate relative quantum yield calculations.
To facilitate this, the software of modern spectrofluorometers, such as the Edinburgh Instruments FS5 Spectrofluorometer, are factory supplied with built-in correction curves that allows the user to remove the wavelength dependent efficiency from measured spectra. Fluorescence spectra that have been corrected using these curves are called “corrected spectra” and should always be used when calculating relative quantum yields. For more details on spectral correction see our post on “Emission Correction in a Spectrofluorometer”.
The absorbance term compares the number of photons absorbed by the sample and reference solutions. In principle, one could prepare solutions that have identical absorbance at the excitation wavelength and therefore absorb the same number of photons. However, this is overly restrictive, and the absorbance term accounts for the sample and reference solutions having different absorbance values at the excitation wavelength. The ratio of the number of photons absorbed by the sample and reference is given by

where AR and AS are the absorbance of the reference and sample solutions at the excitation wavelength. The values of AS and AR are obtained by measuring the absorption spectra of sample and reference, respectively.
If the absorbance of the solutions are kept low (typically A < 0.04),4 Eq. 4 can be approximated to AR/AS, so that Eq. 2 can be re-written as the commonly found formula in the literature and older textbooks,1,2,4

However, using the full absorbance term given in Eq. 4 and included in Eq. 2, is uncomplicated and recommended.
The relative quantum yield calculation assumes that the same fraction of fluorescent light is captured by the spectrofluorometer from the sample and reference solutions. This fraction depends on the solid angle over which the spectrofluorometer collects the fluorescence from the cuvette, which is partly dependent on the refractive index of the solvent (for more details see the appendix). Where possible the same solvent (same refractive index) should be used for the sample and reference to ensure the same fraction of fluorescence is captured from both. However, this is not always practical and the refractive index term, (nS/nR)2, accounts for the difference in fluorescence captured when solvents of different refractive index are used.
The values of the refractive index of sample and solution at the excitation wavelength can be found in the literature. The refractive index is weakly wavelength dependent and where possible the refractive index at the mean emission wavelength should be used.5
To illustrate how to apply the above information, in this section the quantum yield of p-Terphenyl (p-T) is calculated using quinine bisulphate (QBS) as the reference standard.
In principle one could prepare a single solution of the sample and of the reference, measure their absorption and fluorescence spectra and calculate the quantum yield using Eq. 2. However, it is good practise to prepare multiple solutions of the sample and reference at varying concentrations to increase the accuracy and precision of the calculated value.
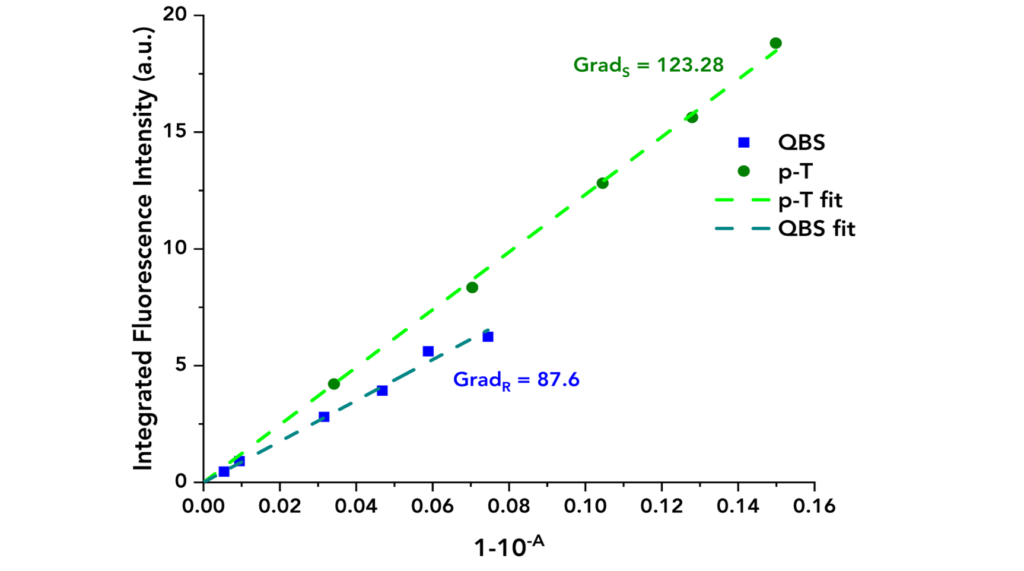
When measuring a series of solutions at varying concentrations Eq. 2 can be rearranged into a linear equation for the calculation of the quantum yield,6

By plotting IS versus 1-10-AS and 1-10–AR versus IR, the “gradients” can be calculated and used to calculate the quantum yield of the sample. This method has the advantage of highlighting potential systematic errors such as dye aggregation which would appear as a deviation from the straight line at higher concentrations.
The normalised absorption spectra of QBS and p-T are shown in Figure 1. The spectra overlap between 280 nm to 320 nm and an excitation wavelength of λex =295 nm was chosen to excite both molecules. Solutions of QBS and p-T were prepared with absorbance ranging from 0.002 to 0.07 at λex.
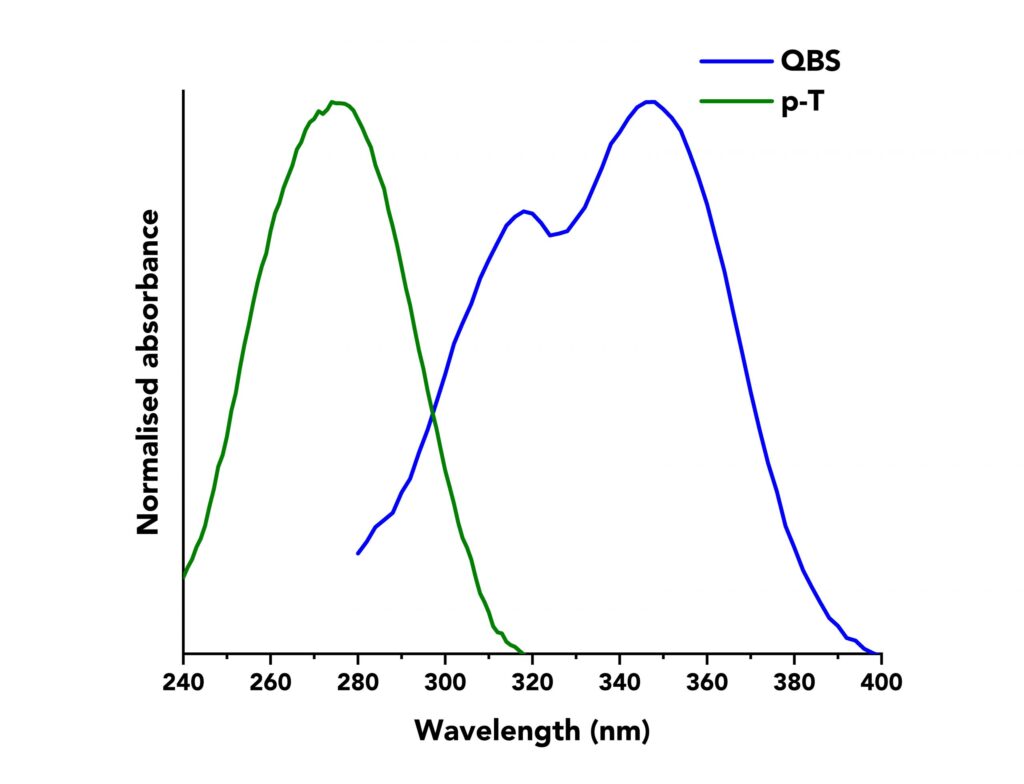
Figure 1: Normalised absorption spectra of p-T (green curve) and QBS (blue curve) acquired on an Edinburgh Instruments FS5 Spectrofluorometer. p-T was dissolved in cyclohexane and QBS in sulfuric acid of 49% w/w.
Next, the values of IS and IR were determined by measuring the corrected fluorescence spectra of p-T and QBS using the FS5 Spectrofluorometer. An example of the normalised fluorescence spectra of both materials can be seen in Figure 2. The emission bandwidth was kept constant at ∆λem =1.8 nm for both materials, as were the values for the step size and integration time (2 nm and 1 s, respectively).
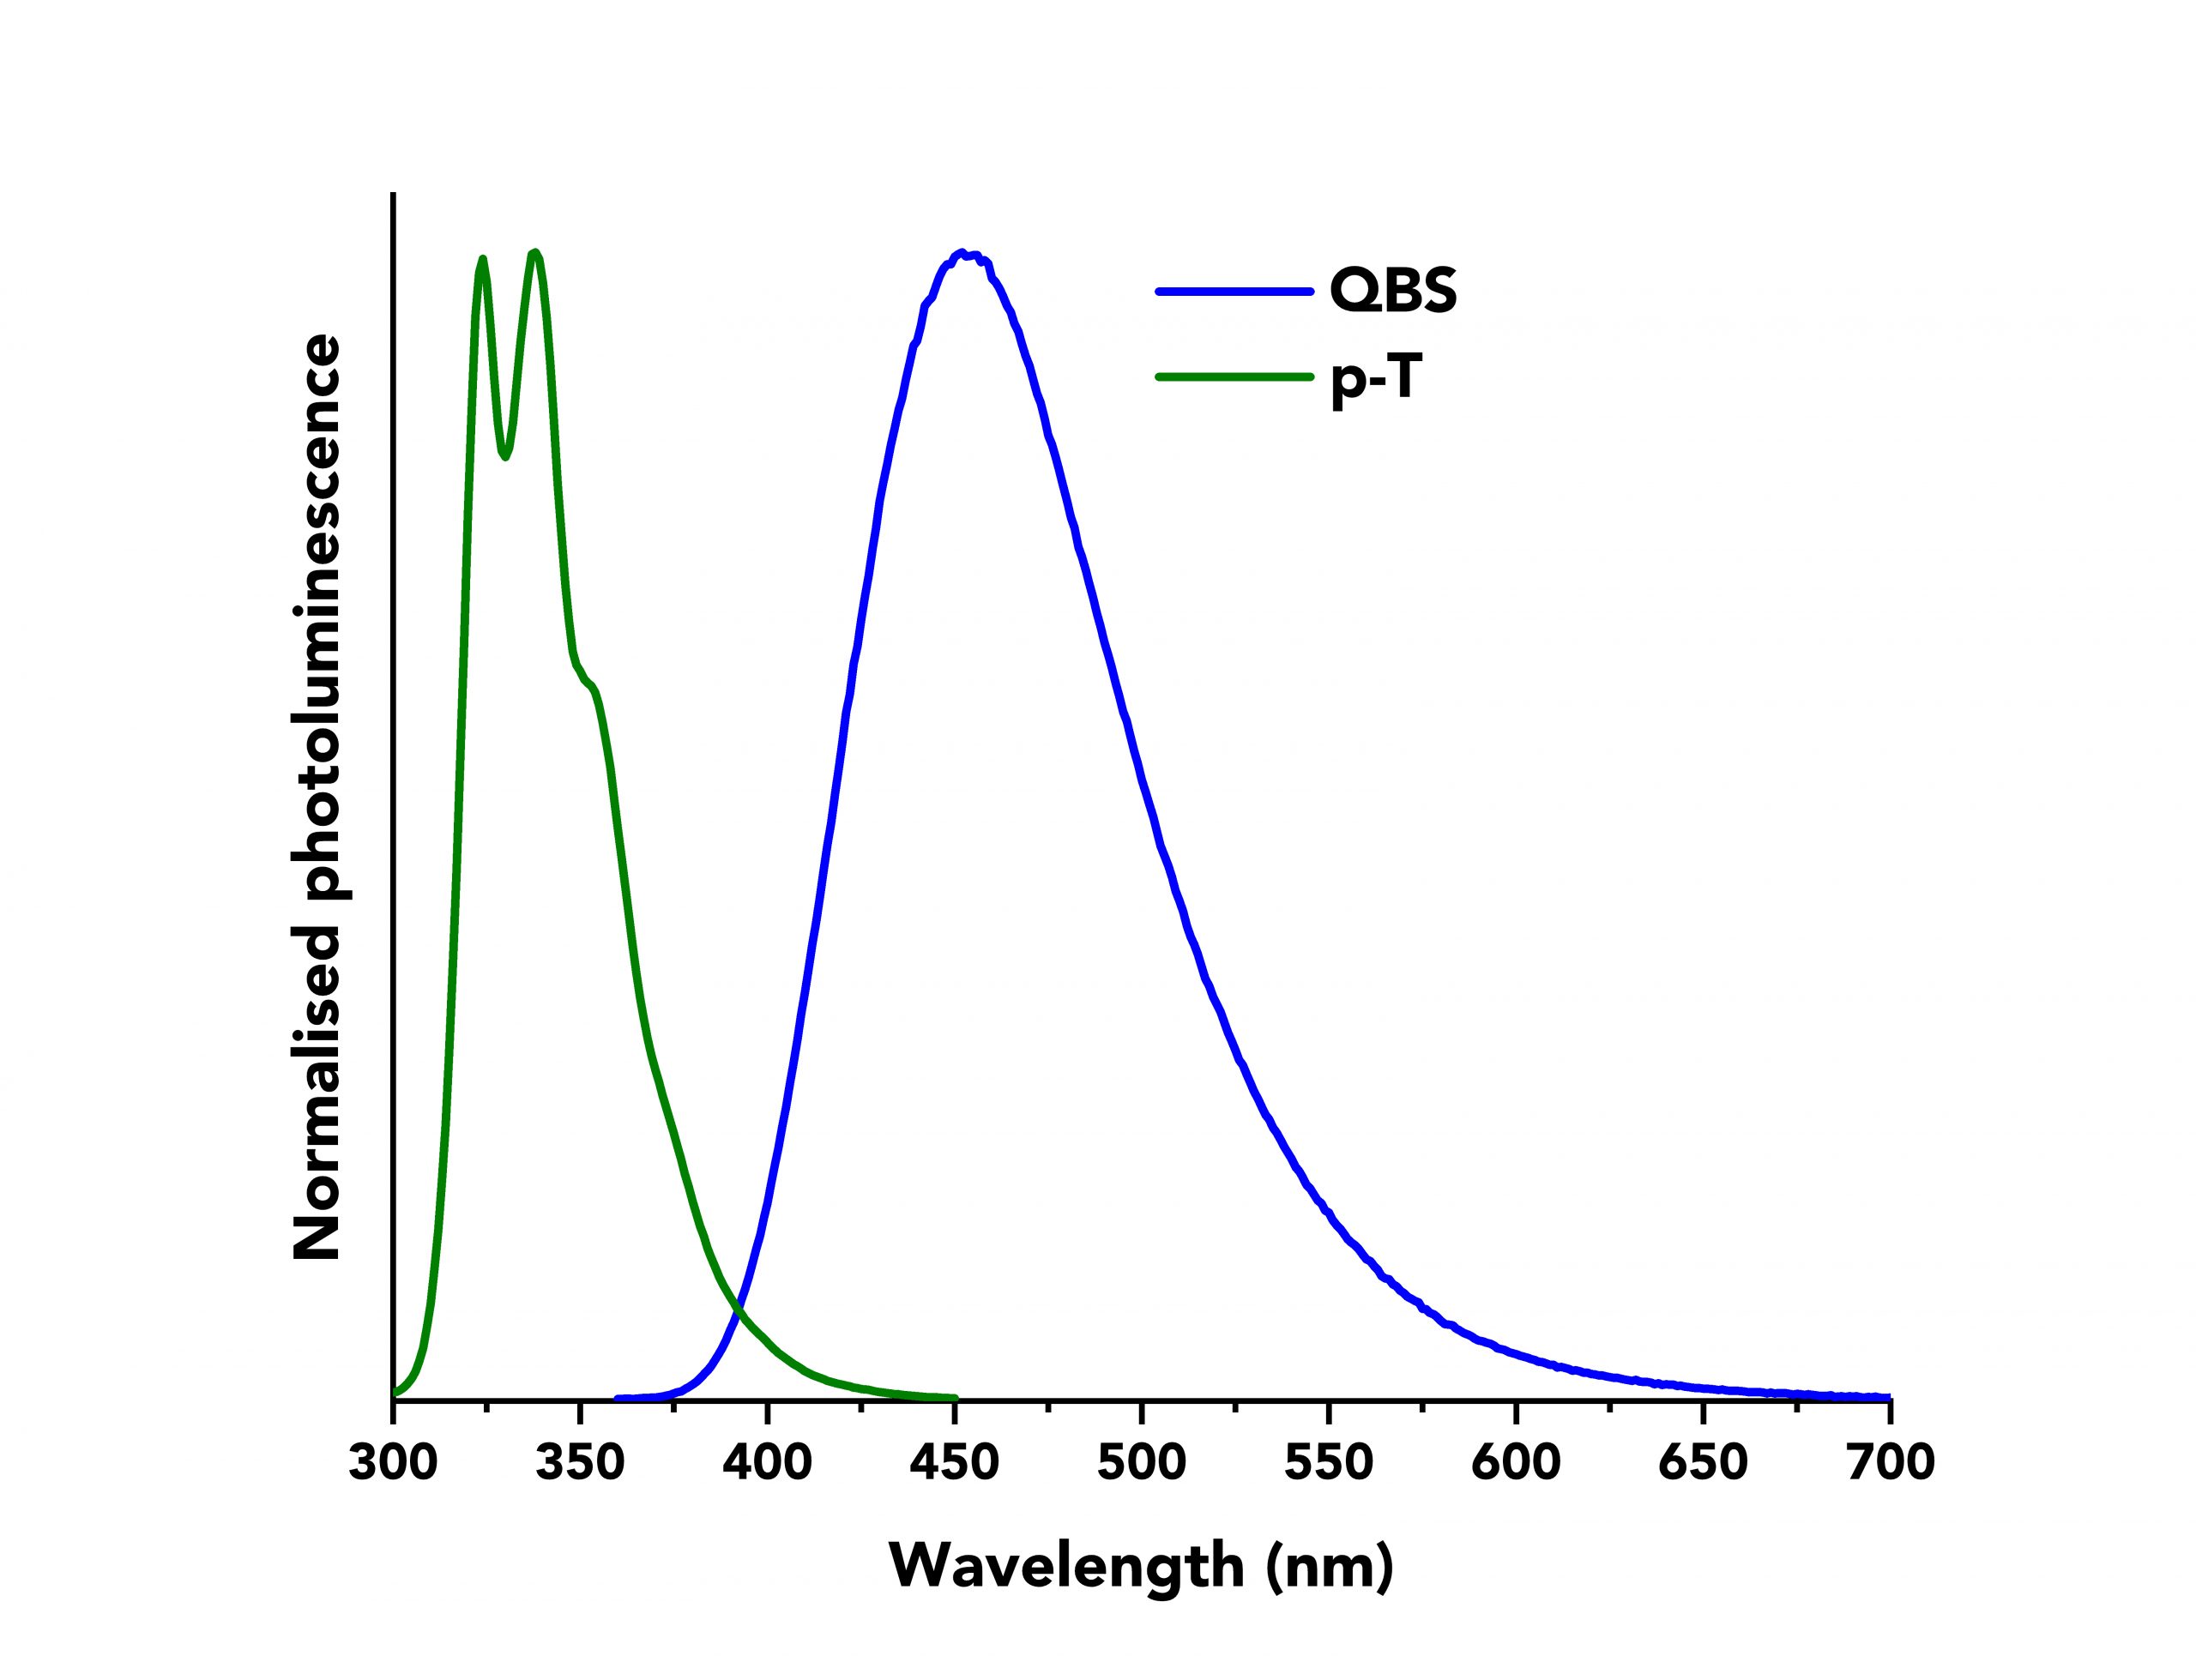 Figure 2: Normalised fluorescence spectra of p-T (green curve) and QBS (blue curve) acquired on an Edinburgh Instruments FS5 Spectrofluorometer.
The acquired data are presented in Figure 3 where the integrated fluorescence intensity is plotted against 1-10-A for each material. Linear fits were applied to both datasets to calculate the gradients. These equalled to GradS = 123.28 and GradR= 87.6 for p-T and QBS, respectively.
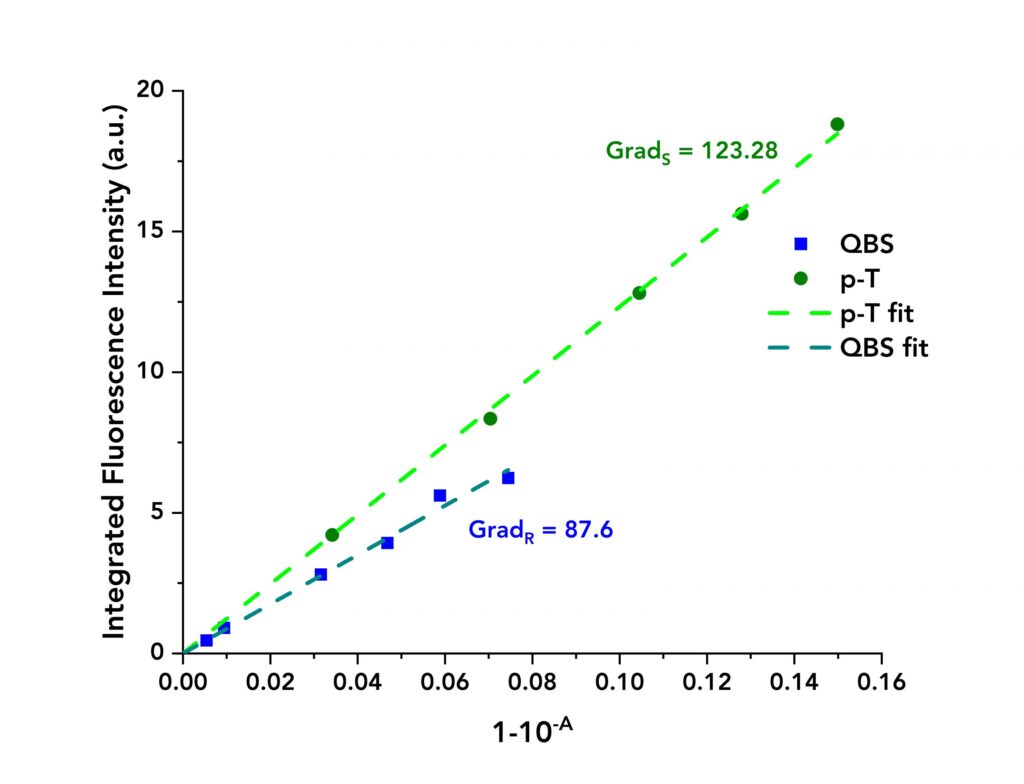 Figure 3: Integrated fluorescence intensity of QBS and p-T vs their absorbance terms (blue dots for QBS and green dots for p-T) along with their linear fits.
The quantum yield of QBS was found in the literature to be фR =56.1% ,7 and the refractive indexes of cyclohexane and sulfuric acid are nS = 1.4496,8 and nR = 1.3337,9 respectively. The quantum yield of p-T using Eq. 6 is calculated to be фs=93.2%, a value which closely agrees with previous reports in the literature of 93%.10
Relative quantum yield measurements seem conceptually simple and straightforward. In reality, however, they are challenging and laborious to get accurate values. This section focuses on providing some useful tips towards accurate relative quantum yield measurements.
The quantum yield of the sample is given by,

where Nf and NA are the number of photons emitted and absorbed by the sample, respectively. Nf in Eq. A1, includes all the emitted photons and therefore it is impossible to be accurately quantified as the spectrofluorometer detects only a certain fraction of the fluorescent (emitted) light. The size of that fraction depends on various factors such as the angular distribution (solid angle) of the fluorescent photons, the refractive index of the solvent(s), the wavelength and geometry, the transmission efficiency of the optical components the spectrometer comprises, and the detector’s quantum efficiency.4,5
The number of the detected photons can be expressed as,
![]()
where k is the proportionality between emitted and detected photons.
The k factor can be cancelled out with the relative method by using a reference sample of known quantum yield. If identical experimental conditions, such as excitation wavelength, slit bandwidths, cuvette size, step size and integration time are used then the fraction of the detected light is identical for the sample and reference.4,5 The ratio of their quantum yields can then be expressed as,4

where the superscripts S and R denote “sample” and “reference”, respectively. Nf,d of Eq. A3, represents a fraction of the photons detected by the spectrofluorometer’s photodetector at λem. The integral of the fluorescence intensity represents the total number of the detected photons at all wavelengths and is defined as,4

The photoluminescence terms of the unknown sample and reference can be expressed as,

The NA quantity of Eq. A1, denotes the total number of absorbed photons and is linked to the measured absorbance of the sample at λex. The absorbance (A) and transmitted intensity (IT) through a solution are defined as,

where I0 is the intensity of the incident light. The absorbed intensity, IA , is defined as,

The number of absorbed photons at λex can similarly be expressed as,
![]()
where N0 is the number of the incident photons and Eq. A4 can then be rewritten as,

When the fluorescence spectra of the unknown sample and reference are acquired under identical experimental conditions, N0 and k can be regarded as equal for the sample and reference so that the ratio фs/фR in Eq. A3 can be rewritten as,

If the solvents used for the sample preparation (unknown and reference) are different, then the difference in their refractive indexes can give rise to two different types of errors when measuring the fluorescence intensity.
The first type of error arises from the fact that the emitted light passes from a material of high refractive index (e.g., the unknown sample’s solvent of nS) to one of lower refractive index (ni, with ni < nS) where the photodetector lies, and as such, the emitted light undergoes refraction at the interface as shown in Figure 4.

Figure 4: The refraction the emitted light undergoes at the interface of two materials of different refractive indexes. Image adapted from Ref. 13.
If the number of fluorescent photons is being emitted from a source within the medium of nS into a solid angle defined by 2θs, then the angular intensity of the emitted light into the source medium can be approximated as,

where I0 is the incident light intensity. If reflections are neglected, the same number of fluorescent photons passes through the interface into the photodetector medium of ni and are now enclosed into a larger solid angle of 2θi due to refraction. As a result, the angular intensity of the emitted light within the photodetector’s medium is decreased and can be approximated as,

By applying Snell’s law at the interface, it yields the correction factor to compensate for the fluorescence intensity decrease,13

The same applies when the reference standard is diluted in a solvent of different refractive index than the unknown sample, so that the correction factor is,

Applying both these corrections to the relative quantum yield equation the ni in each term cancel leading to the refractive index correction term,

The second type of error is from the total reflections the emitted light undergoes within the cuvette. Reflection effects are usually of minor importance and can be ignored depending on the geometry between sample and photodetector.13
For increased accuracy in relative quantum yield measurements the error factors are minimised by using the same solvent for the sample and reference, since the refractive index term can be eliminated when nS = nR.