Fluorescence microscopy is an imaging technique that uses fluorescence, either by intrinsic emission or artificially added fluorophores, to provide contrast to microscope images. In biomedical imaging it offers a high degree of specificity and selectivity thanks to the use of multiple fluorescence labelling where different fluorophores can be used to simultaneously identify specific target molecules and cellular structures. Whereas, in materials science, fluorescence (photoluminescence) microscopy can be used to observe photonic nanoparticles and image the surface of semiconductors for defects.

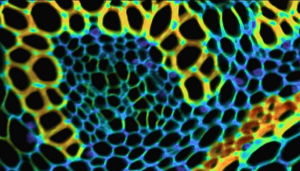
Figure 1: Composite from Widefield fluorescence microscopy showing an image of bovine pulmonary artery endothelial (BPAE) cells acquired using the FS5 Spectrofluorometer with microscope add-on.
Widefield fluorescence microscopy enables detailed cellular images like that of bovine pulmonary artery endothelial (BPAE) cells shown in Figure 1. BPAE cells contain angiotensin converting enzyme (ACE), which is a vital component in the regulation of blood pressure by constricting and dilating blood vessels. In this BPAE sample, the different cell components have been labelled with various colour fluorescent dyes in order to observe the structure of the cells. This technical note shows how a fluorescence image like that of BPAE above, along with emission spectra and lifetime decays, can be acquired using an Edinburgh Instruments FS5 Spectrofluorometer with the microscope add-on.
The sample investigated was FluoCells™ Prepared Slide #1 from Invitrogen™ which contains bovine pulmonary artery endothelial (BPAE) cells. The BPAE cells are stained with a combination of fluorescent dyes, each targeting a specific structure in the cell. MitoTracker® Red CMXRos is used to give red emission to mitochondria, Alexa Fluor® 488 phalloidin to give green emission to the filamentous F-acting network, and blue emitting DAPI to label the nuclei.
Figure 2: FS5 Spectrofluorometer coupled to a fluorescence microscope.
All measurements were acquired using an Edinburgh Instruments FS5 Spectrofluorometer coupled to a Nikon Ni-U Upright Fluorescence Microscope. The FS5 was fitted with the SC-50 Liquid Light Guide Launcher and the excitation and emission light were coupled to and from the microscope using liquid light guides. The FS5 was equipped with a 150W Xenon lamp for steady-state excitation, Time-Correlated Single Photon Counting (TCSPC) lifetime electronics, and a PMT-980 detector. The microscope was equipped with a CMOS fluorescence imaging camera for widefield fluorescence imaging, an epi-fluorescence excitation light guide coupler, an emission light guide coupler, and a laser excitation coupler with an EPL-375 pulsed diode laser.
To acquire the widefield fluorescence images of the BPAE cells the FS5 and microscope were configured as shown in Figure 3. The excitation light is supplied by the Xenon lamp of the FS5, and the desired excitation wavelength selected using the excitation monochromator coupled into the excitation liquid light guide using the SC-50 sample module. The excitation light is coupled into the microscope using the widefield excitation coupler, reflected off a dichroic mirror and into the objective lens to excite the sample. The fluorescence from the sample is collected by the objective, transmitted by the dichroic mirror, passed through an emission bandpass filter to select the desired fluorescence wavelength, and imaged using the CMOS camera.

Figure 3: FS5 and microscope configuration for widefield imaging.
The BPAE cells are labelled with three separate colour fluorescent dyes to visualise the different organelles in the cell. To obtain a complete image of the cells, three separate images of BPAE were acquired using different excitation wavelengths, dichroic filters and bandpass filters optimised for each dye. Figures 4a – 4c show the individual widefield images of the Alexa Fluor® 488 labelled filamentous F-actin, MitoTracker® Red CMXRos labelled mitochondria, and the DAPI labelled nuclei. These individual images were then combined to give the composite image shown in Figure 4d that reveals the complete structure.
The Xenon lamp and excitation monochromator of the FS5 provide a fully tuneable excitation from 200 to 1000 nm; this gives the user more flexibility compared to the filter-based wavelength selection of excitation sources in traditional microscopy. The excitation monochromator and liquid light guide coupling avoids the common disadvantages that arc lamps have when used as fluorescence microscopy light sources; like the need for the lamp to be aligned or the risk that the lamp heat can damage the sample.

Figure 4: Widefield fluorescence image of bovine pulmonary artery endothelial (BPAE) cells. a) Green emitting filamentous F-actin, λex = 480nm with a 520±14 nm emission bandpass. b) Red emitting mitochondria, λex = 580nm with a 641±38 nm emission bandpass. c) Blue emitting nuclei, λex = 380nm with a 447±35 nm emission bandpass. d) Composite image of BPAE (combination of images a, b, and c).
The spectra of the fluorescence emission from the BPAE cells were measured by re-directing the fluorescence into the emission liquid light for detection using the FS5 as shown in Figure 5. Using this approach, the DNA-bonded DAPI in the nuclei of the BPAE cells was excited at 380 nm and the fluorescence spectrum acquired as shown in Figure 6.

Figure 5: FS5 and microscope configuration for spectral measurements.

Figure 6: Fluorescence spectrum of DNA-bonded DAPI.
The FS5 with microscope add-on can also be used to acquire the fluorescence lifetime of the labelled BPAE cells. For fluorescence lifetime measurements a pulsed diode laser source is mounted on the microscope using the laser excitation coupler as shown in Figure 7. The camera and microscope stage are used to focus the laser beam to a particular point of interest in the sample. The desired emission wavelength is selected using the emission monochromator of the FS5 and the fluorescence decay acquired using TCSPC.

Figure 7: FS5 and microscope configuration for lifetime measurements.
Using the configuration shown in Figure 7 an EPL-375 pulsed diode was used to excite DNA-bonded DAPI in a nucleus, and the fluorescence decay acquired at 460 nm using TCSPC which is shown in Figure 8. The decay was fit using the Fluoracle® operating software of the FS5 which showed an average lifetime of 1.85 ns.
 Figure 8: Fluorescence decay of DNA-bonded DAPI acquired using TCSPC.
The FS5 Spectrofluorometer with microscope add-on was used to investigate fluorescently labelled BPAE cells. Using the FS5 Xenon lamp as a continuous range excitation source, widefield fluorescence images of the cells were acquired, revealing the internal structures and features of the cells. Further insight into the properties of fluorescent labels was obtained by measuring their fluorescent spectra and lifetime. This technical note highlights the measurement versatility of the FS5 when equipped with the microscope add-on; being able to acquire images, spectral and lifetime information which together provide a greater understanding of the properties of the sample.