The Beer-Lambert Law (also called Beer’s Law) is a relationship between the attenuation of light through a substance and the properties of that substance. In this article, the definitions of transmittance and absorbance of light by a substance are first introduced followed by an explanation of the Beer-Lambert Law.
Consider monochromatic light transmitted through a solution; with an incident intensity of I0 and a transmitted intensity of I (Figure 1).

Figure 1: Transmission of light through a sample solution in a cuvette.
The transmittance, T, of the solution is defined as the ratio of the transmitted intensity (I) to the incident intensity (I0) and takes values between 0 and 1 However, it is more commonly expressed as a percentage transmittance:

The absorbance, A, of the solution is related to the transmittance and incident and transmitted intensities through the following relations:
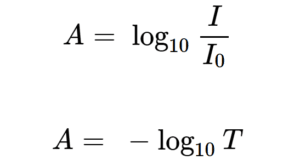
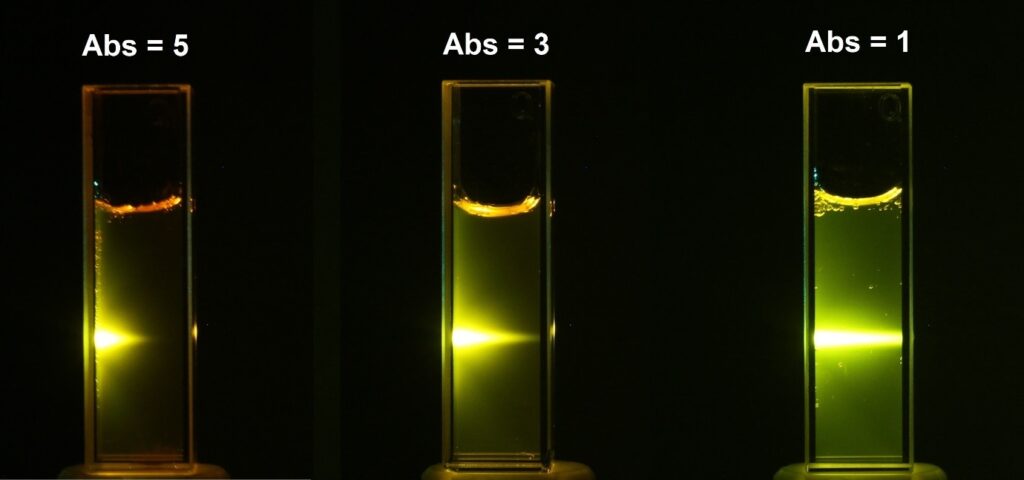
Absorbance is logarithmically related to transmittance: an absorbance of 0 corresponds to 100% transmittance, and an absorbance of 1 corresponds to 10% transmittance. Additional values of transmittance and absorbance pairings are given in Table 1. Figure 2 visually demonstrates how a solution’s absorbance attenuates the light passing through it, where a 510 nm laser passes through three Rhodamine 6G solutions with different absorbances.
Table 1: Absorbance and Transmittance Values:
| Absorbance | Transmittance |
|---|---|
| 0 | 100% |
| 1 | 10% |
| 2 | 1% |
| 3 | 0.1% |
| 4 | 0.01% |
| 5 | 0.001% |
 Figure 2: Attenuation of a 510 nm laser through three solutions of Rhodamine 6G with different absorbance values at 510 nm. The yellow glow is the fluorescence emission at ~560 nm.
Absorbance is a dimensionless quantity and should, therefore, be unitless. However, it is quite common to see units of AU stated after the absorbance which are to either stand for arbitrary units or absorbance units. These units are redundant and should be avoided. Another common encounter is the use of the term optical density or OD in place of absorbance. Optical density is an older term that, in the context of absorption spectroscopy, is synonymous with absorbance; however, the use of optical density in place of absorbance is discouraged by the IUPAC.1
In practice, the absorbance of a sample is measured using a spectrophotometer, where the absorption spectrum is typically obtained by varying the wavelength of the incident light with a monochromator and recording the intensity of the transmitted light. A blank solution (containing only the solvent) is used to measure the incident light intensity, I₀, while the intensity of light transmitted through the sample is measured as I.
The Beer–Lambert law describes a linear relationship between the absorbance of a solution and three parameters: the concentration of the absorbing species, the molar absorption coefficient, and the optical path length:
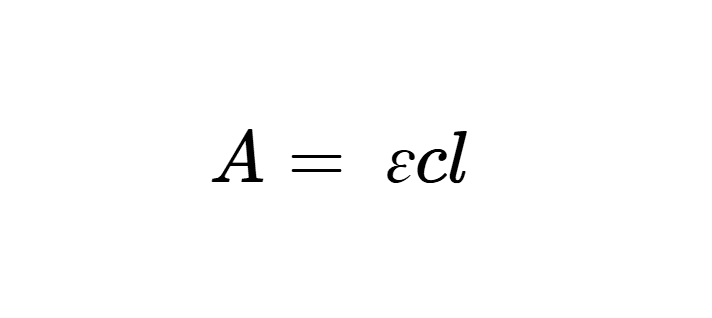 Table 2. Equation description
| Symbol | Meaning | SI Measurement Unit |
|---|---|---|
| A | Absorbance | - |
| ɛ | Molar Absorption Coefficient | M⁻¹cm⁻¹ |
| c | Molar Concentration | M |
| 𝑙 | Optical Path Length | cm |
The molar absorption coefficient is a property specific to each compound and indicates how strongly it absorbs light at a given wavelength. The molar concentration is defined as the number of moles of sample dissolved per litre of solution (mol L⁻¹ or M); and the optical path length is the width of the cuvette used for the absorbance measurement, typically 1 cm.
The Beer-Lambert law establishes a direct linear correlation between solution concentration and absorbance. To demonstrate this linear relationship, five aqueous Rhodamine B solutions of varying concentrations were measured (Figure 3a). The resulting absorption spectra were then used to construct a linear calibration curve by plotting absorbance against concentration (Figure 3b).
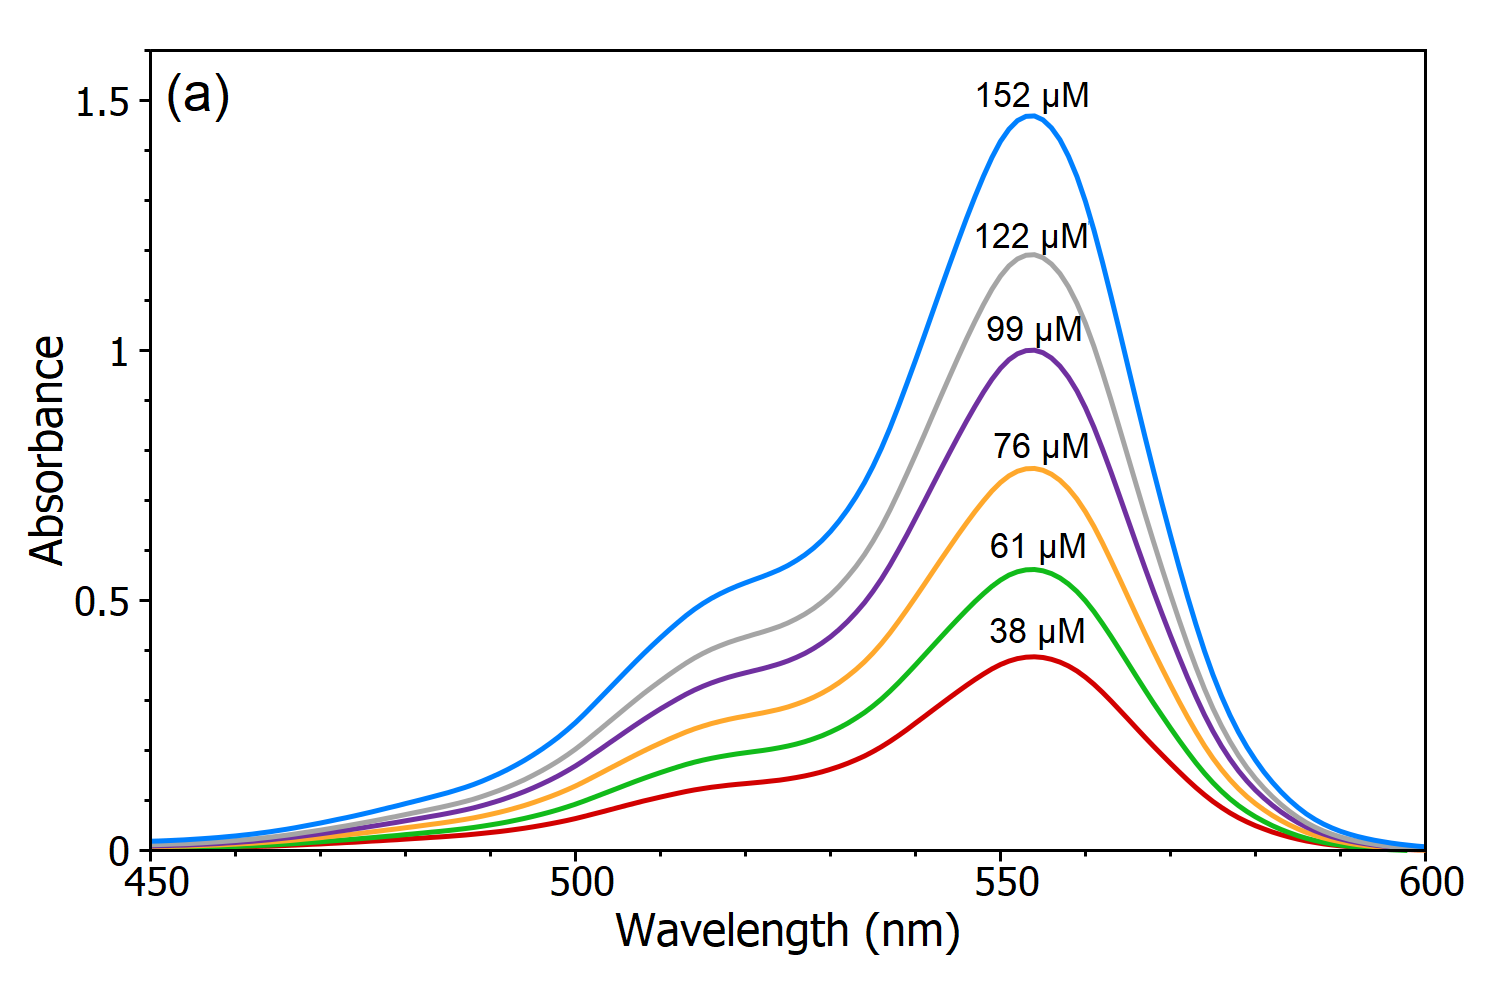
 Figure 3 (a): Absorption spectra of Rhodamine B solutions with different concentrations in water measured using the Edinburgh Analytical DB30 Dual Beam. Spectrophotometer. (b) Calibration curve of Rhodamine B in water measured a λmax.
The calibration curve enables the quantification of an unknown Rhodamine B solution by correlating its measured absorbance with concentration, illustrating the fundamental analytical application of the Beer-Lambert law.
A linear calibration curve follows the standard line equation:
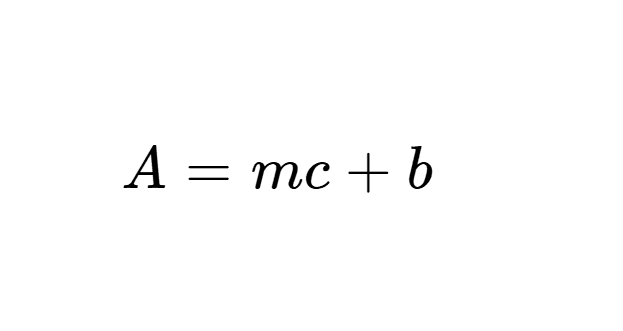
Where A is the absorbance (measured by the spectrometer); m is the slope ɛ𝑙 c is the concentration; and b is the intercept of the calibration curve on the y‑axis, which should ideally be zero, indicating that when the concentration is zero, the absorbance is also zero. In this case, the concentration of a solution can be determined from the absorbance and the slope of the calibration curve according to:
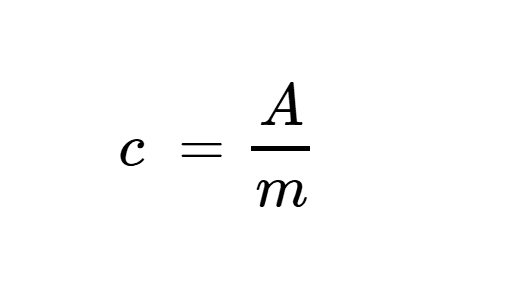
Since the slope of the calibration curve is equal to the product of the molar absorptivity and the optical path length, the molar absorptivity of a compound can also be determined from the calibration curve using the following equation:
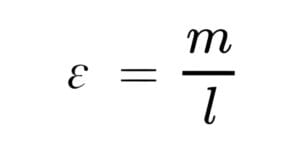
If the cuvette has an optical path length of 1 cm, then the molar absorptivity is numerically equal to the slope of the calibration line.
In conclusion, the Beer–Lambert law is a fundamental principle in spectroscopic characterisation. It describes the relationship between light absorbance, the concentration of the absorbing species, and the optical path length. This principle provides the basis for quantitative measurements, enabling the determination of the solution concentration and the calculation of a compound’s molar absorptivity from absorbance data. Its straightforward nature and reliability have established it as a fundamental analytical model for quantifying light–matter interactions in chemical, biological, and materials science applications.
Discover our range of high end fluorescence spectroscopy equipment, ideal for absorption/transmission measurements.
If you have enjoyed reading our article on the Beer Lambert Law and would like to keep up to date with our latest articles, research and product news, sign up to our monthly eNewsletter via the button below. You can also join us on your favourite social media channel via the buttons at the bottom of the page.