When fluorescence spectra are measured in Edinburgh Instruments fluorescence spectrometers, two types of correction can be applied to the spectra; excitation and emission correction. In this blog post we focus on the role of emission correction and discuss why it is required, how it is implemented, and the effect it has on the shape of fluorescence spectra.
The response of the optical and electrical components that comprise the detection system in a fluorescence spectrometer are wavelength dependent, and the spectrometer will, therefore, detect different wavelengths of light with differing efficiency. The two primary contributions to this wavelength dependence are the diffraction grating efficiency and the photomultiplier tube (PMT) detector quantum efficiency. Figure 1a shows the efficiency of a typical diffraction grating used in an emission monochromator. The grating has low efficiency in the ultraviolet region, optimised to have peak efficiency in the 400 nm – 600 nm region of the spectrum since this is where most fluorophores fluoresce, and the efficiency then decreases gradually towards longer wavelengths. The wavelength dependence of the PMT is more pronounced, with quantum efficiency versus wavelength of a typical visible sensitive PMT detector shown in Figure 1b. It can be seen that the PMT works best at shorter wavelengths and the quantum efficiency steadily decreases as the photon wavelength increases. In addition to these contribtions there will also minor wavelength dependence introduced by the mirrors and lens used to collect and direct the light that also must be accounted for.


Figure 1: The wavelength dependence of (a) grating efficiency of a typical emission monochromator diffraction grating (1200 grooves/mm, 500 nm blaze) and (b) the quantum efficiency of a visible photomultiplier tube detector.
In order to remove the dependence of the detection system on wavelength, an emission correction factor must be applied to measured spectra. Every Edinburgh Instruments fluorescence spectrometer is therefore shipped with a factory generated emission correction factor for each emission lightpath (detector and grating combination) in the spectrometer. These correction factors are generated in a two-part process to ensure the accuracy of the supplied correction factor. The first step is measuring the spectra of deuterium and tungsten calibration lamps. These calibration lamps have a precisely known spectral output when operated at a particular colour temperature that is traceable to a National Physical Laboratory (NPL) certified spectrum. Dividing the lamp spectra measured using the spectrometer with the true spectra of the lamps gives the correction factor of the lightpath. This correction factor is then validated by measuring the spectra of reference fluorophores with known emission spectra that are traceable to the National Insitute for Standards & Technology (NIST) and Bundesanstalt für Materialforschung und –prüfung (BAM). The corrected emission spectra of the fluorophores are compared to the reference emission spectra to confirm that the generated correction factor is accurate.

Figure 2: Emission correction factor of an FS5 Spectrofluorometer with a 1200 groves/mm diffraction grating blazed at 500 nm and a visible PMT detector.
An example of an emission correction factor that was generated using this procedure is shown in Figure 2 with higher y-axis values indicating that the spectrometer is more sensitive at that wavelength. It can be seen that the overall shape of the correction factor is a convolution of the grating and PMT wavelength dependences that were shown in Figure 1. The pronounced dips at 398 nm and 470 nm are Wood’s Anomalies; where the transmission of light with its polarisation component parallel to the grooves of the diffraction grating decreases suddenly in intensity.1,2
The transformation of an uncorrected emission spectrum to a corrected emission spectrum is achieved through the simple algebraic scaling (Eq. 1) by the emission correction factor.

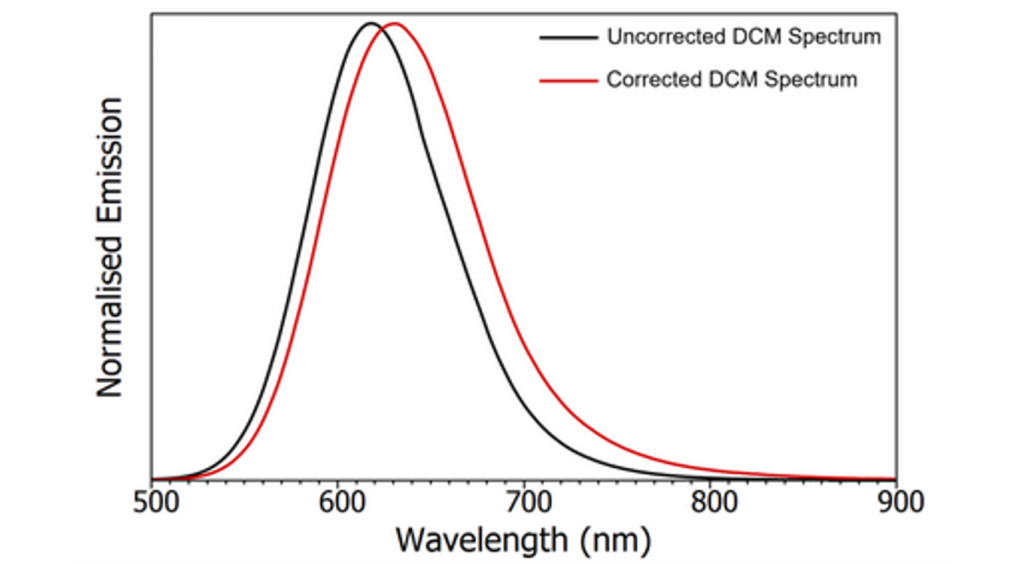
To illustrate the effect that applying emission correction has on the shape of the emission spectrum, uncorrected and corrected spectra of Quinine Bisulphate (QBS) and 4-(Dicyanomethylene)-2-methyl-6-(4-dimethylaminostyryl)-4H-pyran (DCM) are compared in Figure 3. In the case of QBS, it can be seen that the main difference after applying emission correction is the removal of Wood’s Anomaly at 470 nm and an increase in the relative intensity of the red tail of the spectrum. For DCM, which emits deeper into the red, applying emission correction red shifts the spectrum by over 12 nm. The wavelength shift between the uncorrected and corrected spectra is proportional to the gradient of the correction factor in that region of the spectrum, with steeper gradients introducing a larger shift. These examples illustrate the importance of using a spectrometer with an accurate emission correction particularly when interpreting the shape and peak position of fluorescence emission spectra.


Figure 3: Uncorrected and corrected emission spectra of QBS (a) and DCM (b) in 0.1 M sulphuric acid measured using the FS5 Spectrofluorometer.
2. D. M. Jameson, Introduction to Fluorescence, CRC Press (2014)
For more information on the theory and operation of fluorescence spectrometers, check out the frequency asked questions section on our blog.
If you have enjoyed this article, please sign-up to our monthly newsletter and join us on social media to be the first to hear about our latest news and applications. Or to get in touch with a member of our team, please do not hesitate to contact us – we look forward to hearing from you.