In photoluminescence spectroscopy, two key concepts frequently arise when discussing how a spectrometer detects light: bandpass and spectral resolution. While related, they describe distinct capabilities of your instrument. Together, they define the ability of an instrument to distinguish between spectral features.
The bandpass refers to the specific range of wavelengths that an instrument is designed to isolate. Think of it as the “window” of the electromagnetic spectrum that’s allowed to pass through to the detector. Related to bandpass, bandwidth quantifies the width of this window.
On the other hand, spectral resolution describes the wavelength difference between two lines in a spectrum that can still be clearly distinguished. Essentially, it tells you how finely a spectrometer can “see” detail in a spectrum. Higher spectral resolution means the instrument can pick out narrower spectral features. These terms are summarised in Table 1.
Table 1. Relationship between bandpass, bandwidth and spectral resolution.
| Term | Definition | Relation to Others |
| Bandpass | The specific range of wavelengths a spectrometer is designed to transmit, defining the “window” of light reaching the detector (e.g. bandpass of 400 – 410 nm). | Bandpass is the wavelength interval an instrument isolates, characterised by its centre wavelength (CWL) and bandwidth. A narrower bandpass implies higher spectral resolution. |
| Bandwidth | The width of the bandpass, quantifying the specific range of wavelengths the spectrometer collects (e.g. bandwidth of 10 nm). | A quantitative measure of a spectrometer’s bandpass. A smaller bandwidth indicates finer spectral resolution. |
| Spectral Resolution | The ability of a spectrometer to distinguish between different wavelengths, referring to how narrow and numerous the detectable spectral bands are. | Directly related to bandwidth. Higher spectral resolution means the spectrometer detects more and narrower bands, which means smaller bandwidths for each band, providing more detailed spectral information. |
Although spectral resolution is crucial in Raman spectroscopy, its importance in fluorescence varies depending on the fluorophore’s spectral profile. This is because many fluorophores exhibit broad, relatively featureless emission spectra. So, in many cases, changing spectral resolution won’t noticeably affect the observed fluorescence spectrum.
However, adequate (or even high) wavelength resolution becomes critically important in fluorescence in specific scenarios:
Several key spectrometer components directly impact its bandpass and spectral resolution. These include the slit width, grating dispersion, monochromator design and detector configuration (Figure 1).
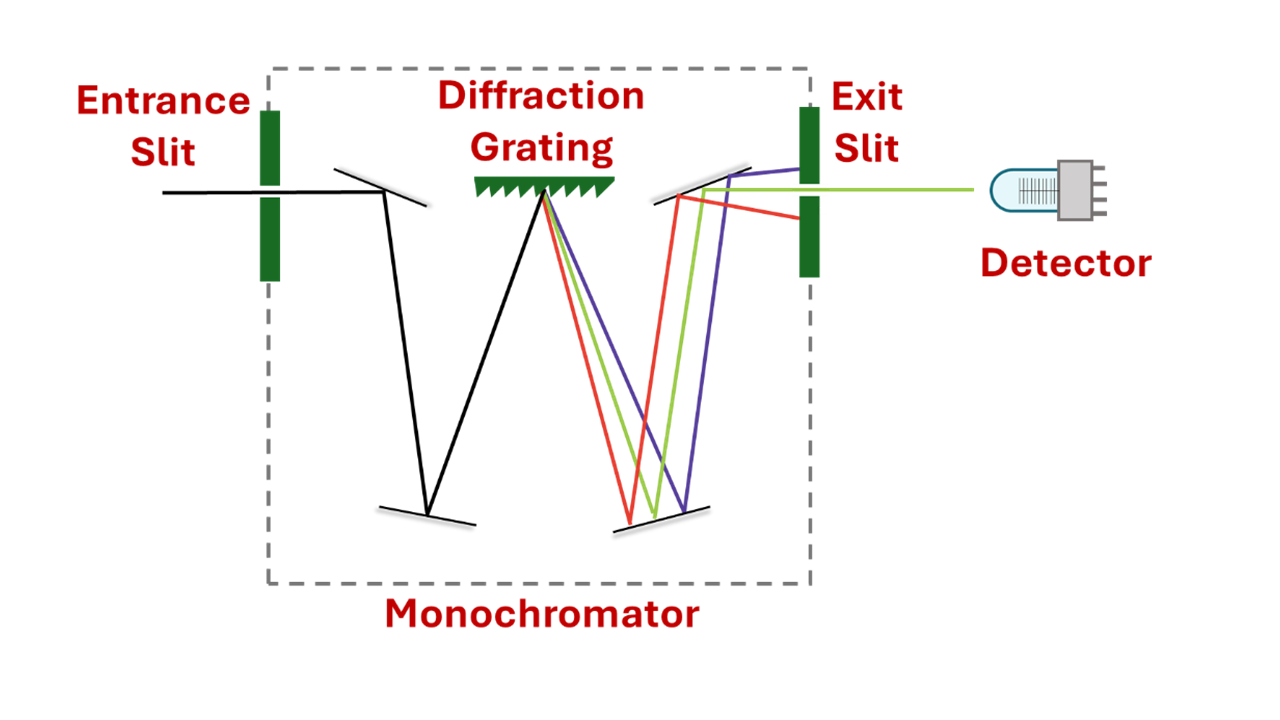
Figure 1. Key Factors Influencing Spectral Resolution.
In a spectrometer, slits are crucial. These adjustable apertures precisely control the amount of light entering and exiting the monochromator, directly impacting both the signal you measure and the detail you can see.
The slit width is what controls the spectrometer’s bandwidth (the width of the bandpass). For example, setting an emission wavelength of 500 nm with a 2 nm bandwidth means the slits and monochromator are positioned to collect light spanning from 499 nm to 501 nm (500 nm ± 1 nm). A narrower bandwidth signifies more precise wavelength selection and thus better spectral resolution.
It’s important to distinguish between the physical slit width and the spectral bandwidth. The spectral bandwidth, often defined as the peak width at half height of the light exiting the monochromator, will always be less than the physical slit width.
The intensity of light passing through the monochromator is roughly proportional to the square of the slit width. Wider slits allow significantly more light through, boosting the signal-to-noise ratio. Conversely, narrower slits improve resolution but drastically reduce light intensity, potentially leading to noisier data.
The spectrometer’s bandpass can be calculated using Equation 1.
![]()
Here, slit width usually refers to the larger of the entrance or exit slit width. The Reciprocal Linear Dispersion (RDL) is a property of your spectrometer’s grating and optics that describes how well a dispersive element, separates different wavelengths of light spatially. It is defined as the change in wavelength per unit distance along the spectrum at the monochromators exit focal plane.
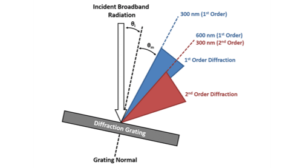
Diffraction gratings, found in both excitation and emission monochromators, are fundamental to separating light into its constituent wavelengths.
Gratings are available with different groove densities (grooves/mm). A grating with higher groove density gives higher reciprocal dispersion, meaning it spreads the light more effectively (Figure 2). Diffracting the light wider provides improved spectral resolution. For instance, a monochromator’s bandpass with a 1200 grooves/mm grating can be half that of a 600 grooves/mm grating (assuming the same slit width). However, a larger dispersion of light comes at the cost of spectral intensity.
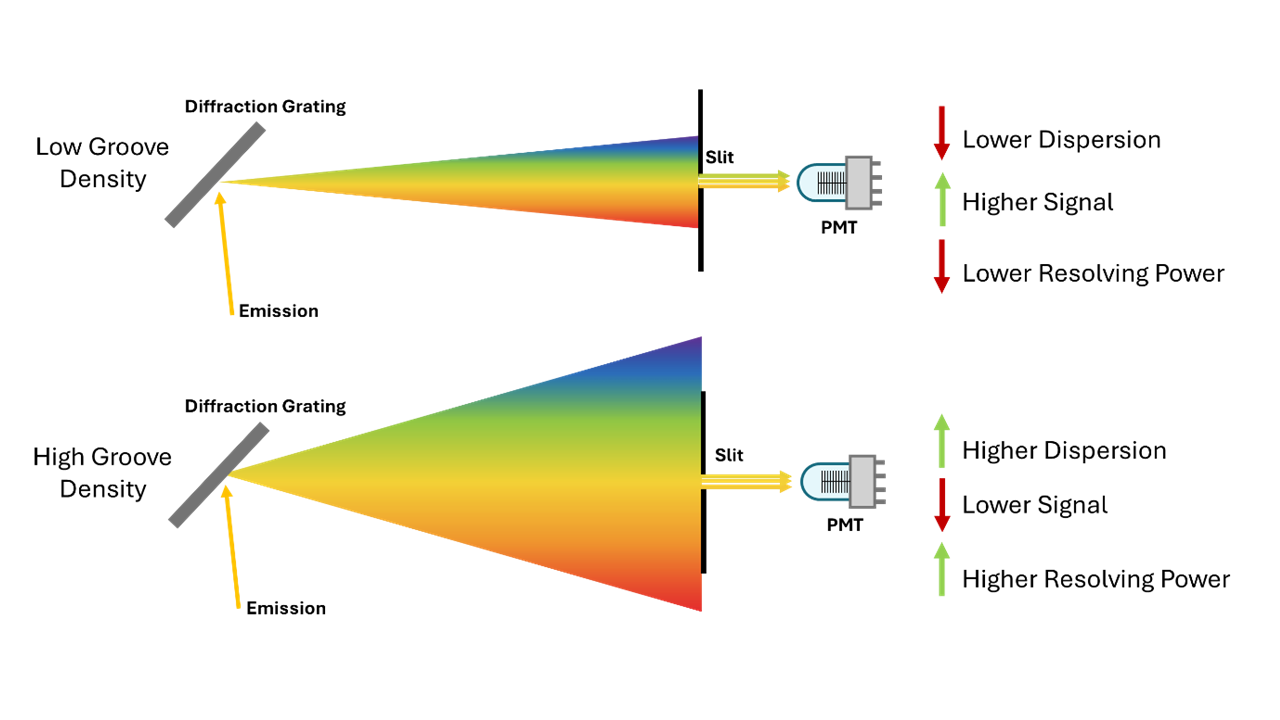
Figure 2. Effect of Groove Density: A higher groove density spreads light more effectively, improving resolution. A lower groove density spreads light less, reducing resolution.
A grating’s resolving power is fundamentally related to its ability to separate wavelengths and is dependent on the spectral order and the number of grooves under illumination (Equation 2).
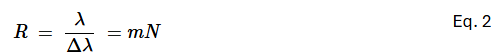
Where:
Often, there are so many grooves under illumination that the entrance and exit slits become the limiting factor for the overall system resolution, rather than the grating’s theoretical resolving power.
The monochromator is the entire optical system comprising the slits, mirrors and the grating, responsible for selecting a specific wavelength of light. Its design significantly impacts spectral resolution.
The focal length of the monochromator affects the dispersion of light. A longer focal length leads to increased dispersion of light, thereby enhancing resolution. In addition, the specific arrangement of mirrors and gratings within the monochromator (e.g. Czerny-Turner) influences optical aberrations and overall resolution. More complex designs (like double monochromators) can offer significantly improved resolution and reduced stray light, which is unwanted light that reaches the detector without passing through the intended optical path. Stray light can obscure weak fluorescence signals, effectively reducing overall resolution.
The detector converts the light signal into an electrical signal, and its characteristics contribute to the overall resolution. The spectrometer design and detector type can determine the optimal slit setup, for example:
While not directly affecting resolution, a detector’s quantum efficiency (QE -its efficiency in converting photons to electrons) impacts the signal-to-noise ratio. A higher QE allows for better detection of weak signals, which is crucial when operating at high resolution where signal intensity is often reduced.
Furthermore, inherent detector noise can limit the ability to distinguish between closely spaced, low-intensity peaks, thereby reducing practical resolution even if the optical components are theoretically capable of higher performance.
A function that defines the spectral resolution of your system and determines how accurately you can resolve narrow spectral features, is the Instrument Line Profile (ILP). The ILP reflects the shape of the spectrum produced if it was illuminated with perfectly monochromatic light (Figure 3). For example, if you were to analyse a light source with a single monochromatic wavelength (λx) on a ‘perfect’ spectrometer the resulting spectrum should be a perfect line at precisely λx. In reality, you would observe spectral broadening resulting in a line profile with finite width. The finite line width of the instrumental response limits the ability to distinguish lines that are close to each other.
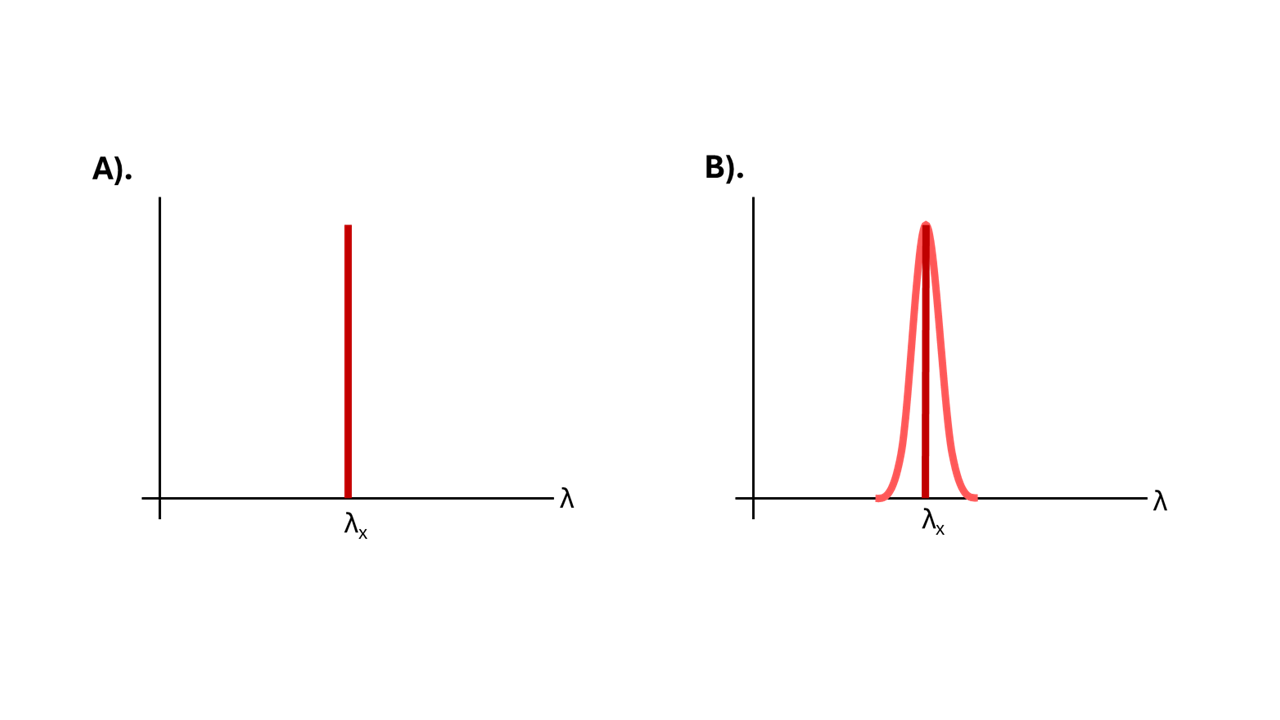
Figure 3. The ILP determines how accurately you can resolve narrow spectral features. A). Theoretical emission spectrum of single monochromatic wavelength source. B). ILP of monochromatic source.
The recorded spectrum is mathematically described as a convolution of the real spectrum of your sample and the ILP (Equation 3).
![]()
The ILP is a function of various parameters including:
Spectral resolution is measured by using the Full Width Half Maximum (FWHM) of narrow monochromatic light through the spectrometer (Figure 4). The FWHM determines the sharpness or broadening of a peak; a lower FWHM indicates a narrower peak and, consequently, higher spectral resolution.
The spectral bandpass of an instrument is also defined by the FWHM of the wavelength distribution passed by the exit slit.
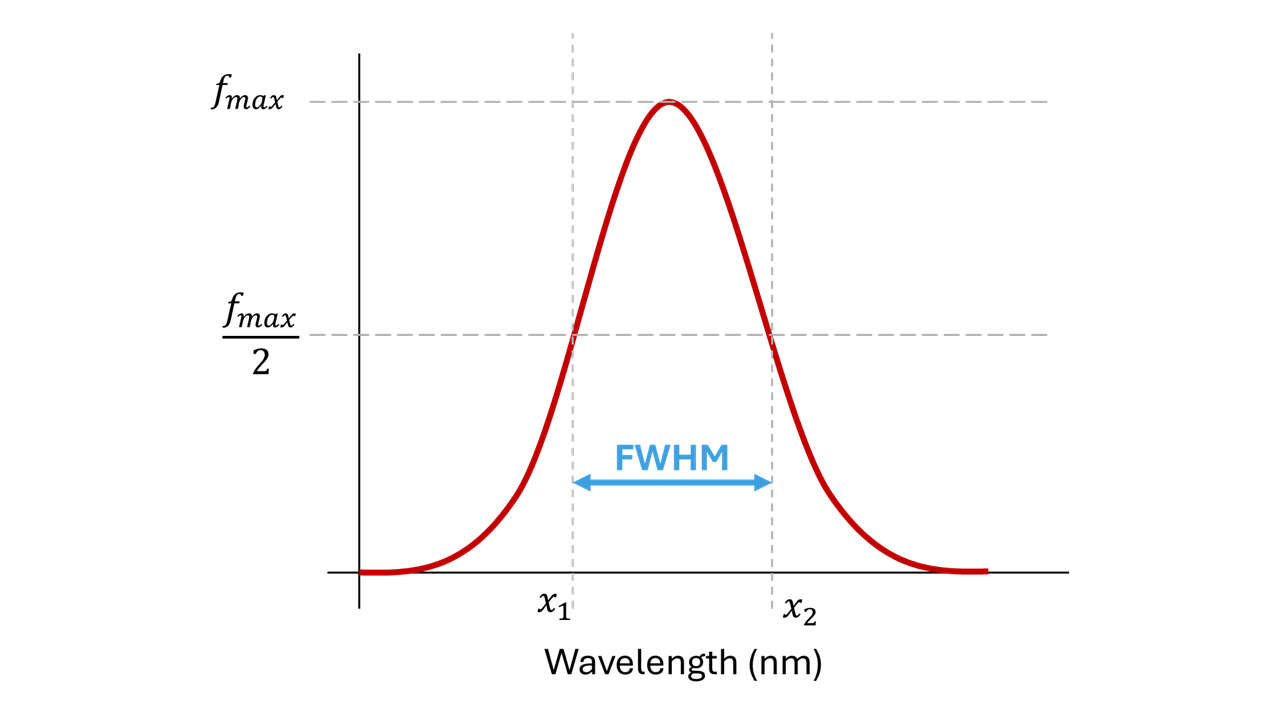
Figure 4. Full Width Half Maximum (FWHM).
The steps for calculating the FWHM are:
The overall resolution of an instrument is limited by the FWHM of its instrumental profile, which is dependent on various causes of line broadening. The total FWHM is calculated using the Equation 4.
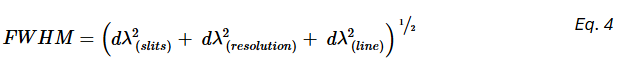
Where:
As discussed, bandwidth significantly impacts spectral resolution. To illustrate this, let’s consider an example using a sample of Nd:YAG (Neodymium-doped Yttrium Aluminium Garnet).
We chose Nd:YAG because of its inherently narrow spectral features, typically around 2 nm wide, making it an ideal candidate for demonstrating the crucial role of good spectral resolution. The collected emission spectra, obtained using varying emission bandwidths, are shown in Figure 5.
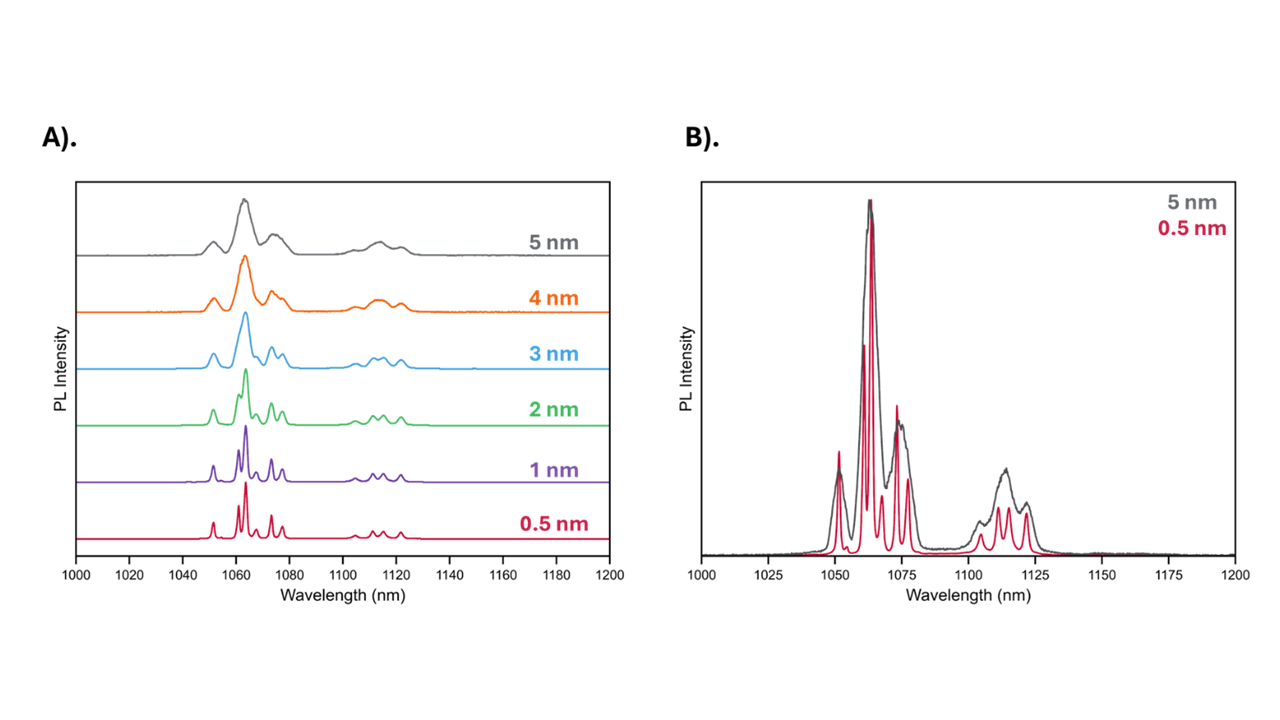
Figure 5. Emission spectra of Nd:YAG collected on FLS1000 PL Spectrometer. A). Bandwidths 0.5, 1, 2, 3, 4 and 5 nm. B). Bandwidths 0.5 nm versus 5 nm. Experimental parameters: Detector = PMT-1400-TE, Excitation = Xenon Lamp, Emission grating = 600 grooves/mm, λex = 355 nm, Step size = 0.2 nm, Dwell Time = 1s.
The spectra clearly demonstrate that as the bandwidth is increased, spectral resolution is progressively lost. The sharp peaks observed with a 0.5 nm bandwidth, for instance, become significantly broadened when the bandwidth is increased to 5 nm. This occurs because a larger bandwidth allows a wider spectral range to pass through the monochromator simultaneously. With a broader spectral range, the instrument’s ability to distinguish individual features decreases, leading to a loss of fine spectral detail.
Ultimately, when measuring fluorescence, there is a choice: do you prioritise high resolution or strong signal intensity?
Finding the right balance between these two factors is paramount for obtaining meaningful and accurate fluorescence data for your specific experimental goals.
Bandpass and spectral resolution are key parameters in fluorescence spectroscopy, directly affecting the ability to resolve fine spectral features. While many fluorophores emit broad spectra, high resolution becomes essential when distinguishing overlapping signals, detecting subtle shifts, or analysing structured emissions.
Spectral resolution is shaped by slit width, grating dispersion, monochromator design, and detector configuration—each involving a trade-off between signal strength and resolution. Using FWHM and understanding the instrument line profile helps optimise this balance. By carefully adjusting these variables, users can achieve accurate, high-resolution fluorescence data tailored to their experimental needs.